
Introduction
The San Pedro River drains an area of 4,720 square miles and flows north from
its headwaters in the Sierra Madre Mountains of northern Mexico for 175 miles to
Winkelman, Arizona, where it joins the Gila River (Figure 1; Arizona Geological Survey
Staff, 2009).

The river hosts a range of vegetation types from xeroriparian and saltcedar
shrublands to mesquite and cottonwood-willow forests (Stromberg et al., 2012). The
river is renowned for its riparian forests and large cottonwood-willow stands that offer
stopover habitat to migrating birds (National Audubon Society, 2022). The streamflow
permanence of the river varies by reach and has been the focus of many research and
conservation efforts in the watershed as urbanization has increased since the 20th
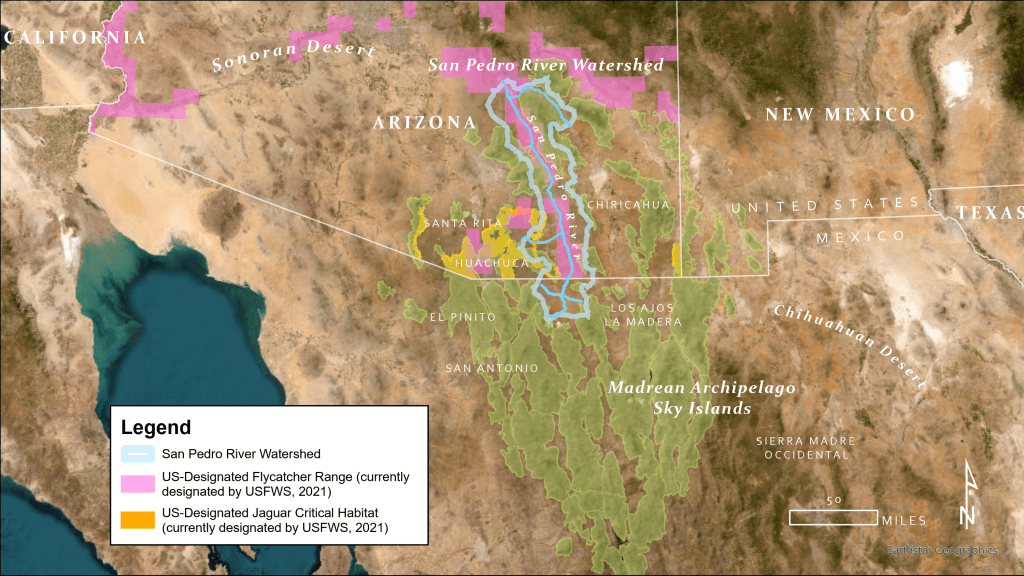
century. The San Pedro Riparian National Conservation Area (SPRNCA) was
established by United States Congress in 1988 to give special protections to
approximately 57,000 acres of public land in the watershed and “to protect and enhance
the desert riparian ecosystem” (U.S. Department of the Interior Bureau of Land
Management, 2022). The SPRNCA overlaps with protected habitats and critical ranges
for federally endangered species, such as the jaguar (Panthera onca) and the
Southwestern Willow Flycatcher (Empidonax trailii extimus) (Figure 2; U.S. Fish and
Wildlife, 2022).
In 2020, the Trump Administration waived over 30 laws, including the National
Environmental Policy Act and the Endangered Species Act, and the US-Mexico border
wall was extended in the SPRNCA across the San Pedro River and its floodplain
(Center for Biological Diversity, 2019). This border wall has fragmented habitats and
created a barrier for large mammals migrating between the United States and Mexico,
including the forementioned jaguar and numerous other species such as javelina,
mountain lion, ocelot, coyote, deer, and others. In addition to hindering wildlife
connectivity, the border wall also poses an issue for the San Pedro River in limiting its
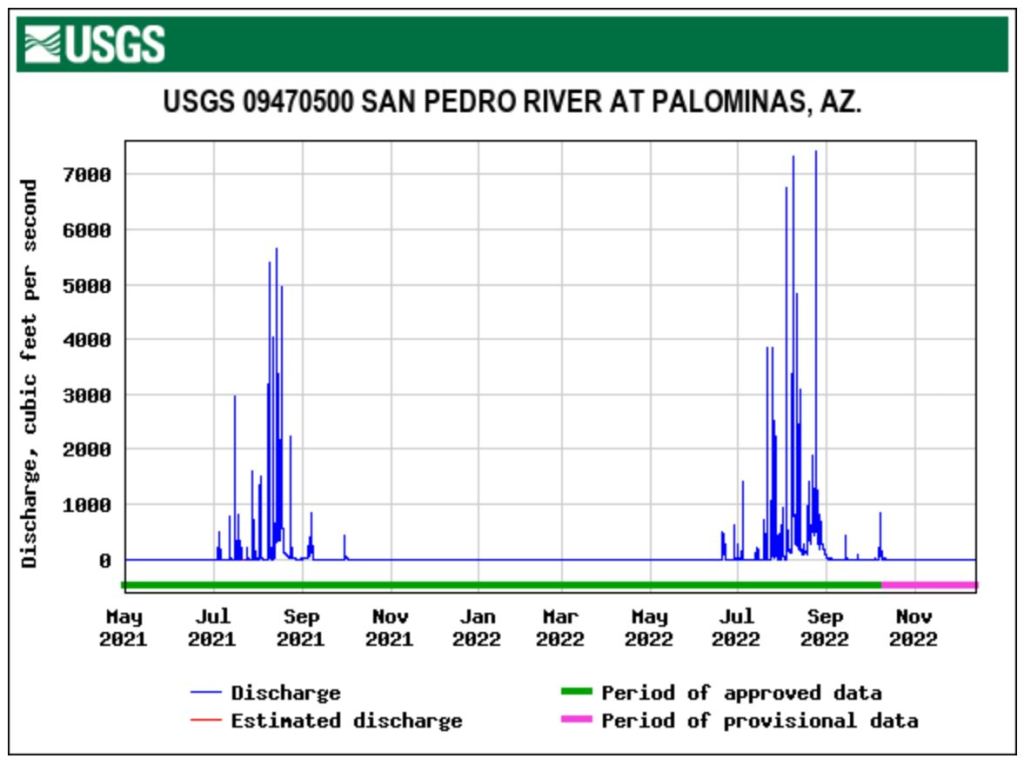
connectivity and natural debris and sediment transport regimes. While the river’s
streamflow at the border is low to nonexistent for many months of the year, intense late
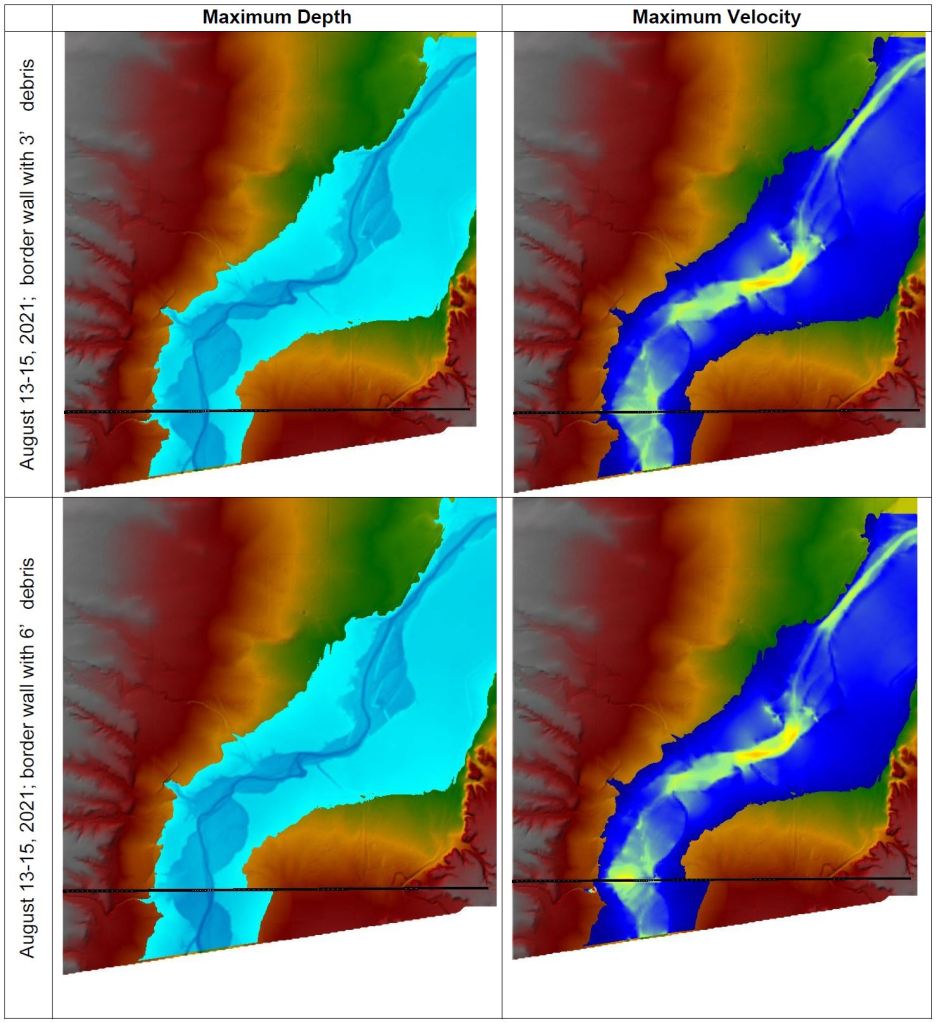
summer monsoon rains result in periods of rapid discharge along the river, including 15
peak flows greater than 10,000 cubic feet per second in the last 92 years on the San
Pedro River at the US-Mexico border (U. S. Geological Survey, 2022; Figure 3, Figure 4).
In this environment, such rapid floods have posed a threat to human infrastructure
developed in the floodplain, as evident from historical accounts of the river overbanking,
cutting new channels, and destroying ranches, residences, bridges, and railways. When
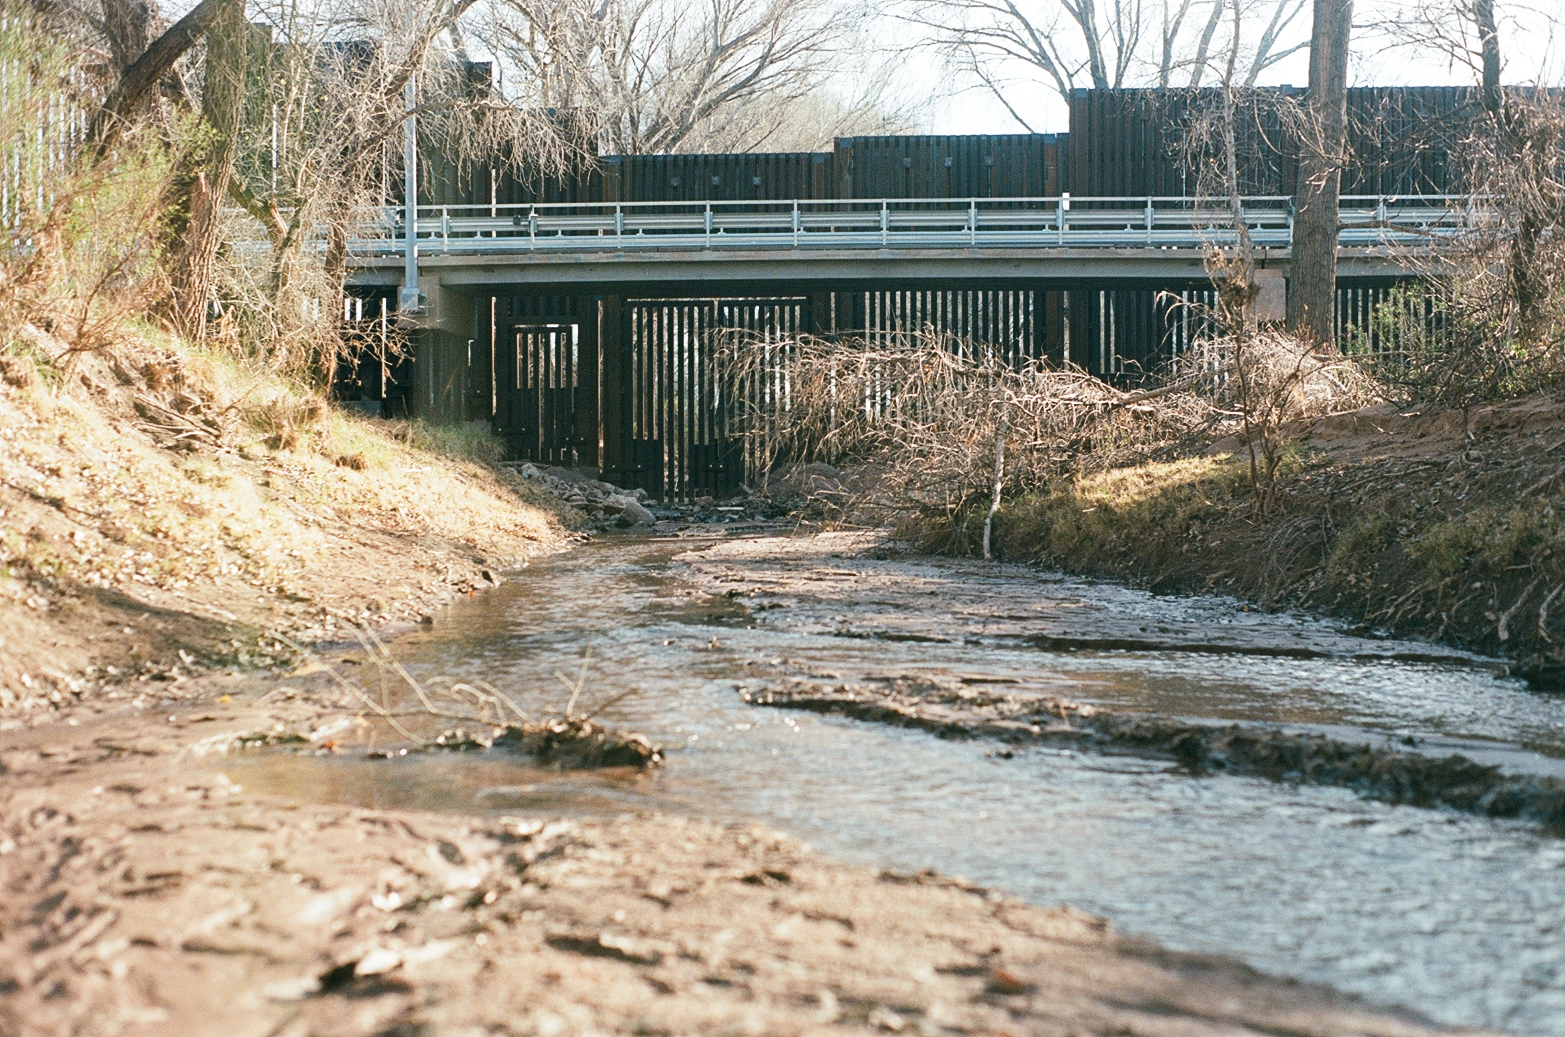
the border wall was constructed, a series of manually operated floodgates were
installed with the intention of allowing large floods to pass freely. However, residents
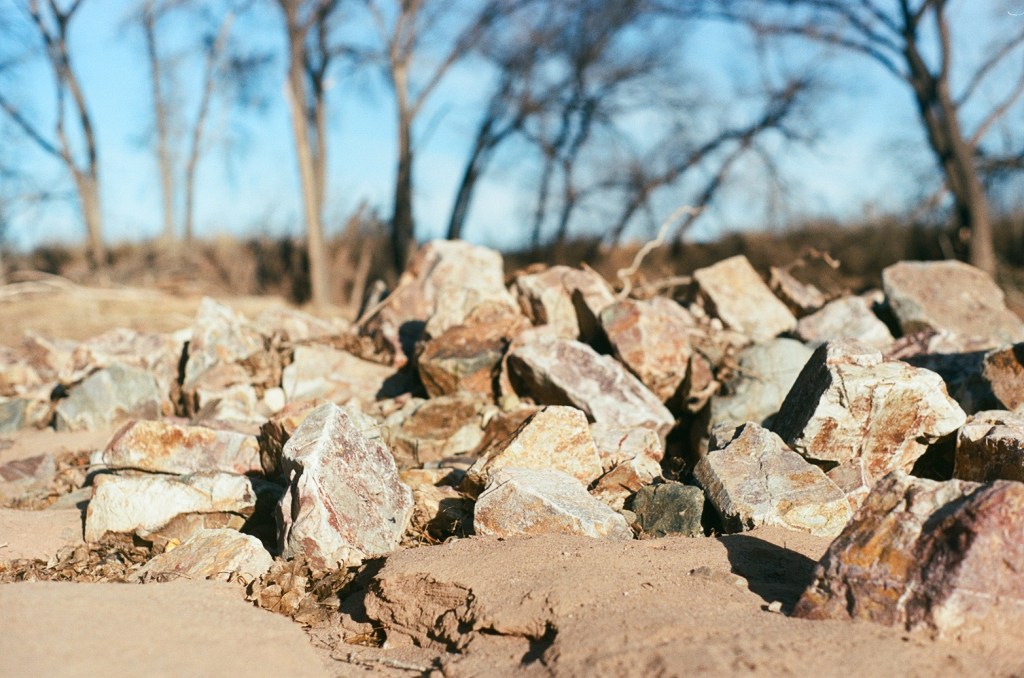
documented debris buildup at the floodgates (Figure 5) in a flood of 5,640 cubic feet per
second (a return interval of approximately 2 years) in August 2021, a year after
construction. It is not yet clear what storm magnitude and debris stage the border wall
and floodgates can withstand before failure, but the same storm system in 2021
severely damaged border wall floodgates at Silver Creek in San Bernardino National
Wildlife Refuge (Figure 6).


In May 2021, following construction of the border wall and floodgates on the San
Pedro River, but before the August 2021 storm, a group of graduate students led by
professor and fluvial geomorphologist Matt Kondolf at UC Berkeley visited the San
Pedro River. During their site visit, they measured the border wall’s floodgates,
established photo stations for repeat photography in and around the San Pedro River
downstream of the border, and measured and tagged large woody debris (LWD).
The primary questions are:
- Has there been any movement of the large woody debris (LWD) during the 19-
month period between surveys? - Is evidence of increased scouring or erosion present downstream of the border
wall on the San Pedro River following the 2021 and 2022 monsoon seasons?
Given the size of the LWD surveyed and the dimensions of the border wall’s
floodgates, it is expected that debris accumulation upstream of the wall will lead to a
damming effect. This is likely to result in increased erosion downstream of the wall as
the river’s excess energy used to transport debris and sediment will instead be
expended on erosion of the channel bed, a phenomenon referred to as “hungry water”
(Kondolf, 1997). This excess energy resulting from interference by the wall may also be
capable of transporting larger quantities and/or sizes of debris than would be expected
without the wall as a barrier. While it is apparent that the design of the border wall and
floodgates have affected the river’s longitudinal connectivity, studies quantifying the
impacts to the movement of debris, sediments, and wildlife have yet to be undertaken.
Literature Review
Geology
The geology of the San Pedro River and its floodplain is a complex stratigraphy
consisting of approximately 20 feet of Holocene alluvium (sand and gravel) followed by
50 to 100 feet of clay, silt, and fine sand terrace deposits from the late Pleistocene and
early Holocene ages, laid atop upper and lower basin fills consisting of clay, silt sand,
and gravel at 150 to 400 feet of depth deposited between the late Miocene and early
Pleistocene ages (Pool and Coe, 1999). The deposits and fills overlay bedrock of
siltstone and conglomerate known as the Pantano Formation. The surrounding
Huachuca and Mule Mountain Ranges and the Tombstone Hills consist of consolidated
rocks, including sedimentary, volcanic, and granitic (Pool and Coe, 1999). Geomorphic
contrasts and a constriction in the San Pedro River Valley structure known as “The
Narrows” separate the river into two distinct reaches: an upper reach flowing along
relatively low gradients ranging from 50 to 150 feet per mile between the Huachuca and
Mule Mountains in Southern Arizona, and a lower reach bordered more closely by the
higher-elevation Galiuro, Santa Catalina, and Rincon Mountain ranges (Wood, 1997;
Tuan, 1962). In the upper watershed, the San Pedro River’s floodplains are relatively
less developed compared to other rivers in the region, and bank stratigraphy remains
relatively intact. This makes the upper reaches of the river appropriate for studying the
formation of arroyos, or gullies carved out by strong torrents of water (Stromberg et al., 2012). Geologic relations and geomorphology of the upper reaches of the San Pedro
River are typically characterized by an entrenched main channel inset within a main
floodplain surrounded by stacked terraces and a wide inner valley, the formation of
which depend wholly on the flashy flood regime of the river.
Flood History
A map of cities, towns, and USGS stream gages on the San Pedro River as of
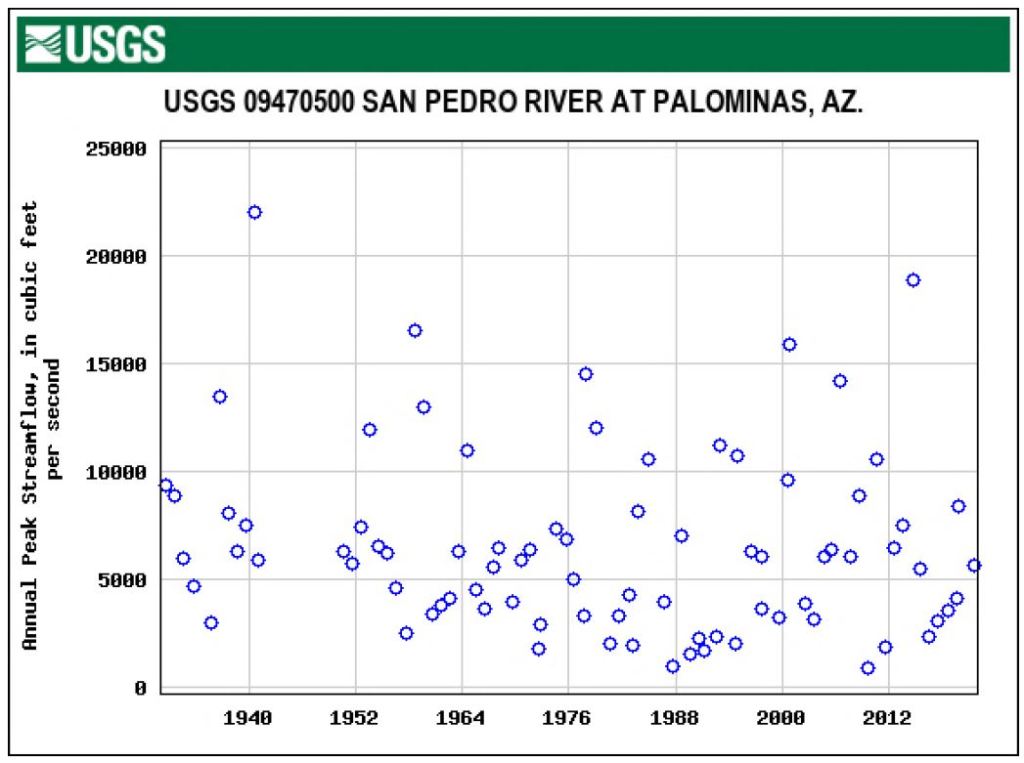
January 2023 is given in Figure 7. The gage at Palominas (USGS gage 09470500)—
established in 1926—will be the primary source of stream gage data for this study.

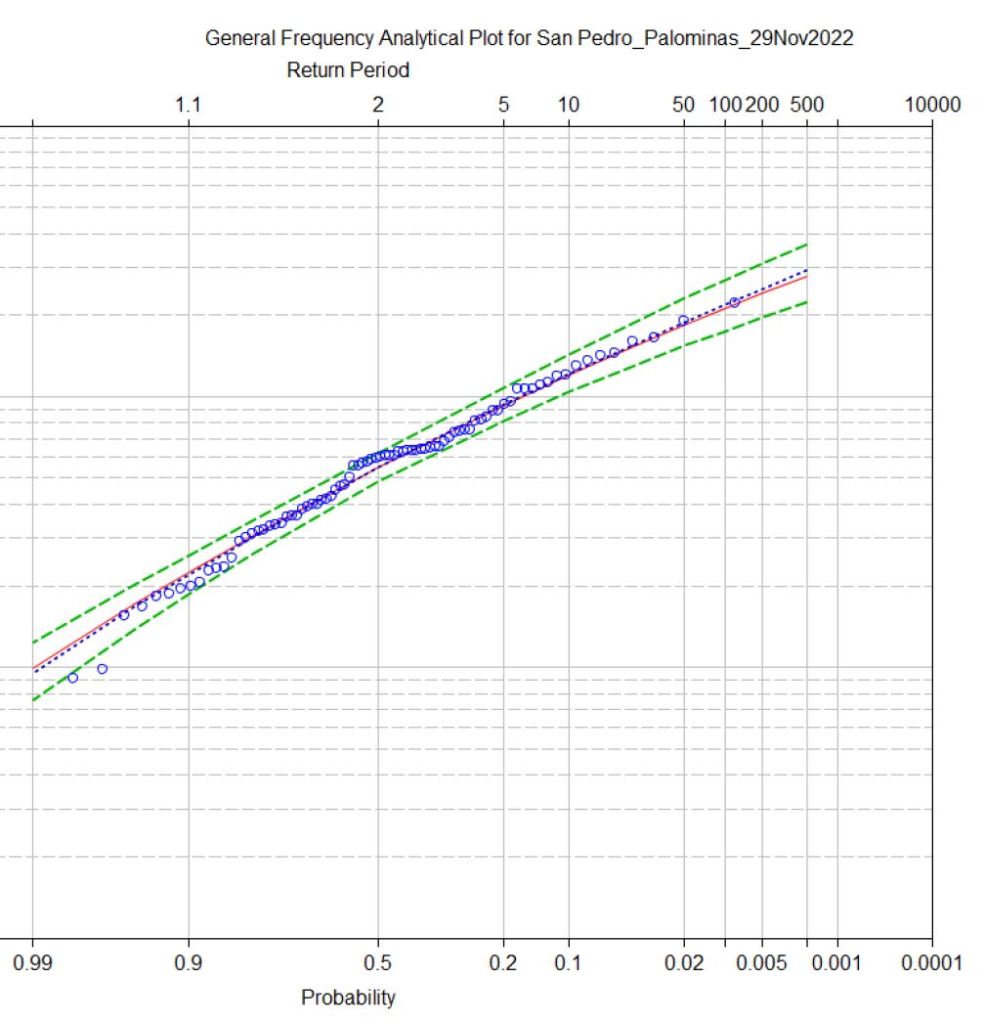
Between 1930 and 2022, 15 peak flows over 10,000 cfs have occurred: a return interval
of approximately 6.13 years. From a generalized flood frequency analysis of the
Palominas gage data using HEC-SSP, a 100-year flood is estimated to be
approximately 22,000 cfs (Figure 8; U.S. Geological Survey, 2022).
Dating before modern stream gage measurements, numerous accounts from
local papers such as the Arizona Weekly Citizen, Tombstone Prospector, Arizona
Republican, Tombstone Epitaph, and others document massive floods on the San
Pedro River that began in the 1880’s. I reviewed archival evidence using public records
available through the Library of Congress (Chronicling America) and related literature –
namely that of J.C. Stromberg and G.R. Noonan – that have documented and
summarized flood events on the San Pedro River and the subsequent geomorphic
response, including channel widening, deepening, entrenchment, and arroyo formation.
Select historical accounts regarding flooding on the San Pedro River from local
newspapers are summarized in Table 1. Remarks from the varying sources range from
quantifiable measurements (e.g., “half a mile wide and twenty feet deep”) to qualitative
impacts (e.g., “several buildings destroyed”). The anecdotes range by location, but the
majority are from Benson, Fairbank, and Charleston. Other accounts are from smaller
towns of Tres Alamos, Dudleyville, Mammoth, Lewis Springs, Hereford, and St. David.
As early as 1887, local papers document large floods on the San Pedro River
that destroyed crops, agricultural fields, and buildings. In 1890, the Tombstone Epitaph
recounted that “the San Pedro River was higher than ever before known, in many
places flooding the valley several feet” (Tombstone Epitaph, 1890; Noonan, 2022;
Wood, 2015). Some accounts, such as the 1890 feature from the Arizona Silver Belt,
document geomorphic changes and arroyo cuttings due to flooding, recounting that “the
river in many places changed its channel…rapidly undermining the intervening ground”
(Arizona Silver Belt, 1890; Wood, 2015). Similarly, in 1891, the Arizona Weekly Citizen
reported a flood that “last August … dug down the channel of the San Pedro River an
average of ten feet” (Arizona Weekly Citizen, 1891). In 1914, the Tombstone Epitaph
documented a flood near Fairbank that “uprooted trees and left a layer of mud and
water over all the land” (Tombstone Epitaph, 1914; Noonan, 2022; Wood, 2015). The
same account noted that this flood on the San Pedro “was the highest it has been for
the past 20 years according to reports received from old timers in that section.”
Many of the accounts collected document damage to the Union Pacific Railroad,
which was constructed over the San Pedro River in 1880, establishing the city of
Benson. The 1896 flood, as reported by the Arizona Republican, “tore out three miles of
Southern Pacific track … sent the floodwater through the east end of town, destroying
several buildings. Twelve persons are believed to be drowned” (Arizona Republican,
1896). The Tombstone Epitaph recounted the same flood of 1896, describing that
“Benson is again all washed away … about half a mile from town east and west of the
bridge which crosses the San Pedro has been … washed away in places to a depth of
four feet … rails with ties attached lifted bodily and deposited fifteen to twenty feet to
one side” (Tombstone Epitaph, 1896; Noonan, 2022; Wood, 2015). Beyond railroad
infrastructure, damage due to flooding has been reported in other cities along the San
Pedro River valley, including Fairbank. The Bisbee Daily Review reported floodwaters in
1905 “carrying out a small bridge … likely to close the road for a couple of days. The
bridge at Clifton went out for the third time in four months … a repetition of washouts
that have kept the road closed almost continuously during the last two months” (Bisbee
Daily Review, 1905). Similarly, the Bisbee Daily Review (1914) reported that the “state
highway bridge at Fairbanks was completely under water” due to flooding on the San
Pedro in 1914. Notably, the flooding that occurred on the San Pedro in September 1926
is recognized as one of the most damaging storms in the region’s history. As reported
by the Arizona Daily Star, the floods of September 1926 were the largest floods
recorded on the San Pedro River with an approximate gage height of 23.9 feet
(Noonan, 2022; Tellman & Hadley, 2006; U.S. Geological Survey, 2022). The city of
Bisbee reported a record monthly rainfall at 10.19 inches (NOAA National Weather
Service, 2022). The USGS stream gages at Charleston, Redington, and Winkleman
recorded the peak flows on the San Pedro River during this storm as 98,000, 90,000,
and 85,000 cubic feet per second, respectively. The State Bureau of Highways reported
damage due to this storm valued at $60,000 (NOAA National Weather Service, 2022)
and the USGS valued the damages at $450,000 (U.S. Geological Survey Fact Sheet
2005-3081, 2022).
Additional news accounts from more recent decades further illustrate the nature
of the San Pedro River’s flashy flood regime. In early August of 2006, two men driving a
truck towing a trailer attempted to pass the Hot Springs Canyon Wash and were swept
downstream by heavy floodwaters; the men fell out of the vehicle and their bodies were
later recovered downstream (Death in Hot Springs Canyon, 2022). In August 2022, a
man and child were stranded in their car near Hereford, Arizona, due to floodwaters
during a monsoon storm on the San Pedro River (KOLD News 13, 2022).
The flood history documented in this report is limited to the portion of the
watershed within the United States and as such is not exhaustive; there are likely other
historical accounts of extreme flooding on the San Pedro River. However, the
anecdotes and streamflow data included herein illustrate the nature of the river’s flood
regime and resulting impacts to human development.
Debris Transport, Longitudinal Connectivity, and Barriers
The upper watershed beyond the border wall consists mainly of grassland,
mesquite woodland, and desert scrub in the low valley, while the headwaters near the
Sierra la Elenita-la Mariquita and Sierra Los Ajos are covered by oak woodland and
forests of pine and aspen (Kepner, 2002; Carnahan et al., 2018). As documented by
Stromberg et al. in Conservation and Ecology of the San Pedro River (2012), the floods
at the turn of the 19th to the 20th century reconfigured the river into a wide, braided
channel and “facilitated the establishment of riparian forests of cottonwood and willow”
through the processes of channel incision, widening, and arroyo development. The
cottonwoods and willows founded on the alluvial surfaces created by these large floods
now line the banks of the San Pedro River as mature stands, replacing what was
formerly marshland. Large tree branches frequently fall into the river channel during
floods, and occasionally whole trees are uprooted and transported downstream during
intense storms. U.S. Customs and Border Protection (CBP) is responsible for
maintaining the border wall and floodgates on the San Pedro River. Their current
monitoring protocol is to open the floodgates at the start of the monsoon season
(around mid- to late June) and keep them open for the duration of the monsoon season,
which typically lasts until the beginning of October. The largest of the floodgates are 15
feet wide, which is not sufficient for allowing larger debris and tree falls that easily
extend beyond 20 feet in length to pass the border.
As originally defined by Taylor et al. (1993), landscape connectivity refers to “the
degree to which the landscape facilitates or impedes movement among resource
patches.” This can be applied to the border wall when considering the movement of
large mammals—such as deer, pronghorn, javelina, bobcats, and many others,
including threatened species like the jaguar and ocelot—which are too large to pass
through the narrow space between the border wall’s 30-foot-tall steel bollards. In this
way, the border wall acts as barrier to wildlife and prevents movement and migration of
large species in a biodiverse region. Robert Peters, a conservation biologist with
Defenders of Wildlife, reported that “a continuous border wall could disconnect more
than 34 percent of U.S. nonflying native terrestrial and freshwater animal species from
the 50 percent or more of their range that lies south of the border” (Peters et al., 2018;
Pearce, 2022). While much media attention has justifiably been focused on the border
wall’s impacts to wildlife movement, the wall similarly affects the movement of other
organic material. Landscape connectivity also refers to the transference of organic
resources such as large woody debris. In the case of the San Pedro River, the border
wall prevents large mammals from passing, except for in the monsoon season when
CBP opens the floodgates in anticipation of flooding, giving animals a narrow window of
opportunity to cross from one area to another (if environmental conditions even allow,
as the floodwaters may not). Similarly, and even when the floodgates are opened, large
woody debris may not be able to pass naturally if not sized small enough to fit through
the 15-foot-wide floodgates.
Building from the River Continuum Concept (Vannote et al., 1980), ecological
connectivity subsequently was described by Ward (1997) as the “exchanges of matter
(water, sediment, nutrients), energy (organic detritus), and organisms
(movement/migration) across the riverine landscape” in vertical, lateral, and longitudinal
dimensions. Longitudinal connectivity in riverine systems generally refers to sufficient
continuity in streamflow to allow resources to pass from upstream to downstream.
Currently, the dialogue surrounding barriers to longitudinal connectivity is largely
focused on dams, weirs, and culverts (e.g., Adaptive Management of Barriers in
European Rivers [the AMBER Project]; Branco et al., 2014; Rodeles et al., 2020), as
these prevent or constrict flows of water and sediments and prevent fish passage. The
border wall system is a new type of obstruction that warrants further study to better
understand and quantify impacts to streamflow, processes of erosion and scouring,
sediment, debris, and propagule transport regimes, and organismal exchange.
Methods
The methods are separated into three sections: (1) methods used during the
initial visit to the study site in May 2021, (2) methods used during a follow-up site visit in
December 2022, and (3) hydraulic modeling.
The May 2021 survey took place before monsoon season, which allowed for a
clear image of the channel’s morphology and bedform after construction of the wall, but
before any flooding. In August 2021, a flood with a return interval of approximately 2
years (Figure 15; USGS, 2022) occurred on the San Pedro River. Locals documented at
least 3 feet of debris accumulation at the floodgates following this storm (Figure 5). The
following year, in August 2022, the river reached a peak streamflow of 7,410 cfs at the
Palominas gage, which corresponds to a return interval of approximately 4 years
(USGS, 2022). The December 2022 survey was the first survey completed on the San
Pedro River following flooding after construction of the border wall.
May 2021 Site Visit
Border wall floodgate measurements, photo points, and woody debris surveys at
the San Pedro River were first recorded by G.M. Kondolf and graduate students during
an initial site visit in May 2021. Following construction of the border wall and floodgates
over the San Pedro River in 2020, the purpose of the May 2021 site visit was to
document initial conditions through (1) photo stationing and (2) tagging of LWD prior to
flooding with the border structure in place.
Establishing Photo Stations
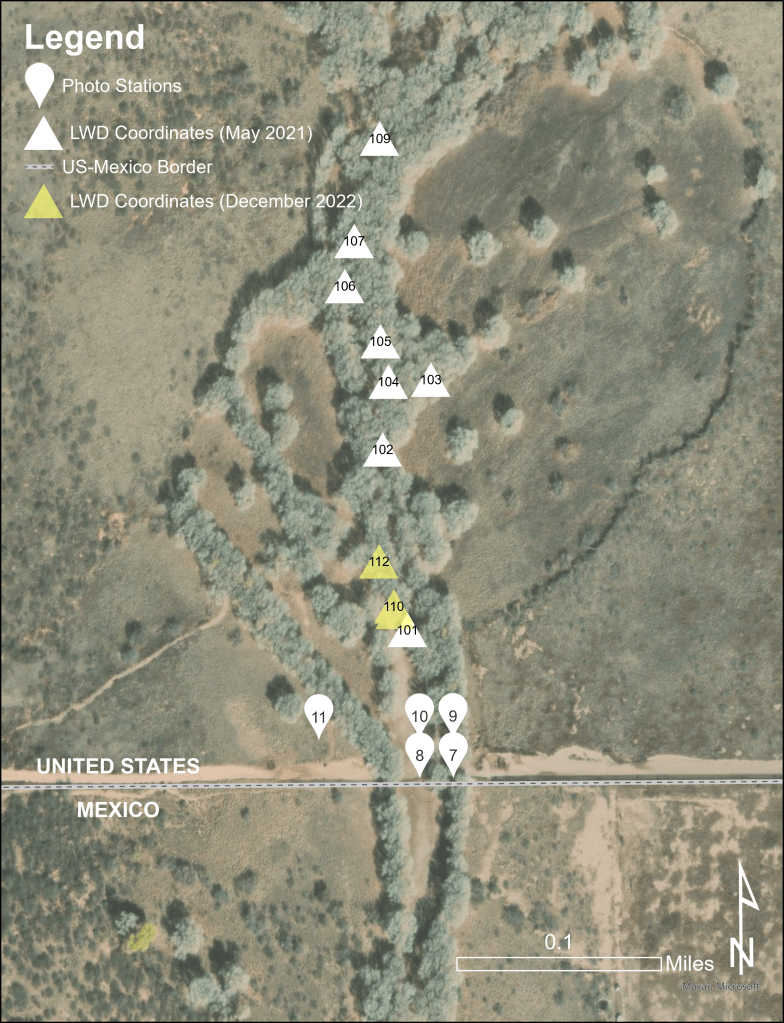
The initial survey group established five photo stations north of the border to
document conditions downstream of the border wall and floodgates, as depicted by
white triangles in Figure 9. At each photo station, the team recorded three to four photos
using a DSLR camera. Each photo was taken from a different angle to capture a
comprehensive perspective of the site conditions. The placement of the photo stations
was intended to capture the river’s bed conditions, bank conditions, location of large woody debris relative to the channel and the wall, and conditions and/or presence of
any debris accumulation on the left floodplain. Notably the photo stations are limited to
US property only (e.g., only the downstream side of the wall). The survey group used
handheld GPS devices to record the coordinates of each photo station. The
coordinates, compass bearings, and notes from May 2021 photo stationing are
recorded in Table 2.
Tagging Large Woody Debris (LWD)
Debris tagging methods are intended to document the movement of large woody
debris downstream of the border wall following floods. Tracking LWD and correlating its
movement to seasonal flooding allows us to study at what flood return interval debris is
mobilized, and if the border wall has any effect on mobilization or accumulation of
debris.
The May 2021 survey group tagged, measured, and recorded GPS coordinates
of 9 pieces of LWD downstream of the border wall using handheld GPS devices,
measuring tape, metal tree tags, and orange spray paint. Locations of LWD tagged in
May 2021 are depicted by pins in Figure 9. The survey team measured and recorded
the length, width, diameter, branch quantity measurements, and photos of each piece of
LWD to relocate the LWD during future site visits. Coordinates, measurements, tag
numbers, and notes describing the LWD surveyed in May 2021 are summarized in
Table 3.
December 2022 Site Visit
Revisiting Photo Stations
I revisited the photo stations on December, 10th, 2022 to document visible
changes since the May 2021 survey. I referenced the GPS coordinates and compass
bearings for the photo points established in May 2021 to repeat photography using a
mirrorless camera. I used a handheld GPS device and digital camera to capture photos
at each station in December 2022 (Table 2). After photographing the site from each
station, I matched each photo from December 2022 to its corresponding photo from
May 2021 to assess visible change to channel morphology. The subsequent images
from each photo station are intended to illustrate differences in bank stability, bed
conditions, and channel topography between surveys and to assess if the presence of
the border wall and floodgates led to increased erosion and scouring downstream of the
wall following flooding.
Revisiting Large Woody Debris
I used Gaia GPS and a handheld GPS device to revisit LWD that was surveyed
in May 2021 and to record new recruitment of LWD during the December 2022 site visit.
I walked to each of the coordinates recorded in May 2021 in search of the woody debris
that was tagged and referenced photos to in attempt to recognize the debris in field. If I
was unable to find or recognize the LWD at its GPS coordinates from May 2021, I
walked downstream in search of the debris and continued to reference photos to recognize the debris in field. I continued to walk 0.3 miles downstream in search of the
LWD tagged in 2021 and if I was unable to find or recognize it, I documented it as
“unrecovered.” The debris may have been transported further downstream beyond the
study reach (e.g., the 0.3 miles I traveled in search of the LWD) or may have been
broken apart during flooding and rendered unrecognizable.
Similar to the intention behind tagging the first series of LWD in May 2021, the
purpose of tagging and recording this new recruitment LWD is in attempt to recognize it
in future site visits and track its movement following the next season’s flood. I chose to
tag large debris (e.g., over 25 feet in length) that could be most easily recognized during
future site visits and was generally located in the river’s main channel at the time of the
December 2022 survey. For recording new recruitment LWD in December 2022, I used
metal tree tags and orange spray paint to tag the LWD. I used a hammer and nail to tag
each piece of LWD. I used spray paint in a distinct pattern along the length of each
piece of LWD so that if the debris is broken into smaller pieces following future floods, it
could be more easily recognized in future site visits. I used measuring tape to record the
length and diameter measurements of each piece of new recruitment LWD and used a
handheld GPS device to record the coordinates where each piece of LWD was located.
I took photos and descriptive notes for each piece of newly recruited LWD that was
tagged. It should be noted that this debris may have been present during the May 2021
site visit, but may have not been tagged at the time.
To examine changes in channel morphology over time, I established benchmarks
for three cross sections downstream of the border wall in December 2022. I located
benchmarks for each cross section on an existing mature cottonwood on either bank of
the river. I tagged, spray painted, photographed, and recorded the GPS coordinates of
each cottonwood used as a benchmark for use in future surveys. I located each cross
section with the intention to capture the topography of the river’s banks and channel at
three different locations:
Cross-Sectional Surveys
- A location closest to the wall and where the riprap pile and scour pools were
most prominent. - A location further downstream where the riprap had settled and the channel
took on a more homogeneous and less topographically dramatic form. - A location further downstream where a 5-foot pile of debris had accumulated,
and a scour pool had formed near the in-channel island between the wider,
historic channel and new, narrower, active channel.
I recorded cross sections beginning nearest the border wall (Cross Section 1;
XS-1), where bank incision, scour pools, and a large pile of riprap were observed. Cross
section 2 (XS-2) was surveyed further north from the wall, beyond where the riprap had
been transported. Cross section 3 (XS-3) was the furthest cross section from the border surveyed and was intended to capture a large pile of woody debris accumulation between the smaller active channel and the wider historic channel. I used a level, stadia rod, and measuring tape to conduct the cross-section surveys, following procedures described in Harrelson et al. (1994). For each cross section, we recorded foreshots at approximately 20-foot intervals and at slope breaks and other key points along the cross-section (e.g., the top of the riprap pile, the water line in the active channel, the channel thalweg, etc.). The intention of establishing these cross sections was to assess the topography of the channel as of December 2022 for comparison in future surveys to detect changes in channel form following seasonal flooding.
Grain Size Analysis
I used the Wolman Pebble Count method (1954) to measure the river’s natural
bed material and the riprap placed downstream of the wall following construction. Using
the pebble count method, I collected and recorded the intermediate (b) axis
measurements for 100 pebbles of each type (e.g., I collected 100 particles classified as
riprap and 100 particles classified as “natural” bed material). Locations where material
was collected for pebble counts are depicted in Figure 13. I chose clearly defined
locations of (1) small riverbed gravels and (2) riprap for the pebble counts.
Hydraulic Modeling
I modeled the border wall using the USACE’s Hydrologic Engineering Center’s
River Analysis System (HEC-RAS) and the floodgate dimensions and quantities
recorded by the May 2021 survey team. The border wall system at the San Pedro River
consists of 9 main channel gates that measure 15 feet in width and 20 feet in height, as
depicted in Figure 14. Adjacent to the main channel gates on each bank of the river are
smaller gates that measure 5.5 feet in width and 12 feet in height. 4 of these smaller
gates are constructed on the right bank, while 52 are installed on the wider, shallower
left bank, where the channel was located before migrating to its current position.
I used a 1-meter resolution digital elevation model from the USGS (2021) to build
the terrain and modeled the wall as a 10-foot-wide, 30-foot-tall weir with a weir
coefficient of 2.6. I modeled the floodgates according to their opening sizes measured in
the field. The rate of opening and closing was set constant at 12 feet per minute with a
minimum water depth of 2 feet required for the gates to open and close, respectively. I
selected a roughness coefficient of 0.05 based on field observations from the May 2021
site visit and comparison to roughness estimates of other rivers on a visual basis based
on the Roughness Characteristics of Natural Channels (Barnes, 1967; Appendix A). For
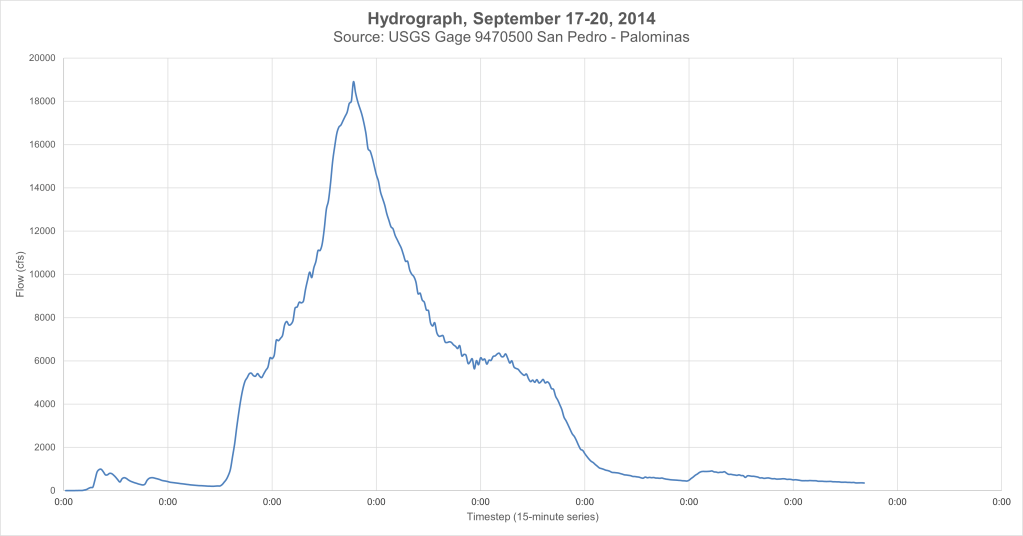
the upstream boundary condition, I used hydrographs from the USGS gage 09470500
(San Pedro at Palominas) for a stage time series to simulate a 2-year storm (Figure 15)
and a 50-year storm (Figure 16). For each storm simulation, I modeled four scenarios of
debris accumulation:
- No border wall (natural condition).
- Wall and floodgates present with 0 feet of debris accumulation (gates clear).
- Wall and floodgates present with 3 feet of debris accumulation.
- Wall and floodgates present with 6 feet of debris accumulation.
For each simulation, the downstream boundary condition was held constant at
normal depth. I held the existing grade slope for distributing flow at the upstream and
downstream boundaries as constant at 0.01 and 0.03, respectively, based on the
average slope at the upstream and downstream boundaries of the study site (NASA
SRTM DEM, 2022).
To model the varying debris accumulation conditions, I assumed that only the
main channel gates would be affected (e.g., low flow gates on left and right banks
remain clear of debris in all simulations). For each stage of debris accumulation, I
reduced the main channel floodgate opening size and increased the main channel
floodgate invert elevation by the same dimension to simulate a damming or weir effect
(e.g., to simulate 3 feet of debris accumulation, I reduced opening sizes from 20 feet to
17 feet and raised the invert elevation from 1302 feet to 1305 feet; to simulate 6 feet of
debris accumulation, I reduced opening sizes from 20 feet to 14 feet and raised the
invert elevation from 1302 to 1308). The conditions and assumptions for hydraulic
modeling are summarized in Table 4. I compared the resulting maximum inundation depth and maximum flow velocity maps from each event and debris accumulation simulation to assess at which storm magnitude and stage of debris accumulation that increased flooding, scouring, or
erosion may occur.
Results
Surveys were completed on Saturday, December 10, 2022, and Sunday,
December 11, 2022. On Saturday, December 10th, the weather was clear, sunny, and
the average temperature was 57.2 degrees Fahrenheit. Wind speeds hovered between
5 and 7 miles per hour headed South/Southeast. On Sunday, December 11th, the
weather again was clear and sunny, with an average temperature of 60.4 degrees
Fahrenheit. The wind speeds picked up later in the day and reached up to 15 miles per
hour in the South/Southwest direction.
On both Saturday, December 10th, and Sunday, December 11th, there was active
streamflow in the narrower, separate channel near the right bank (e.g., east) of the San
Pedro River. No streamflow was present in the wider main channel at the time of the
December 2022 survey. The streamflow in the narrower active channel was measured
to be approximately 3 inches in depth from the thalweg where cross sections were
surveyed. USGS records from the Palominas gage (2022) indicate the streamflow
hovered around 1.5 cfs on both survey days.
Photo Stations
Results of May 2021 and December 2022 photo stationing are reported in Figure 17. The left column corresponds to photos taken during the May 2021 site visit and the
right column corresponds to photos taken at the same GPS location and compass
bearing during the December 2022 site visit. Photographs of the river in May 2021
represent the state of the river following construction of the border wall and before the
first monsoon season. In comparison, photographs of the river in December 2022
represent the state of the river two monsoon seasons following construction of the
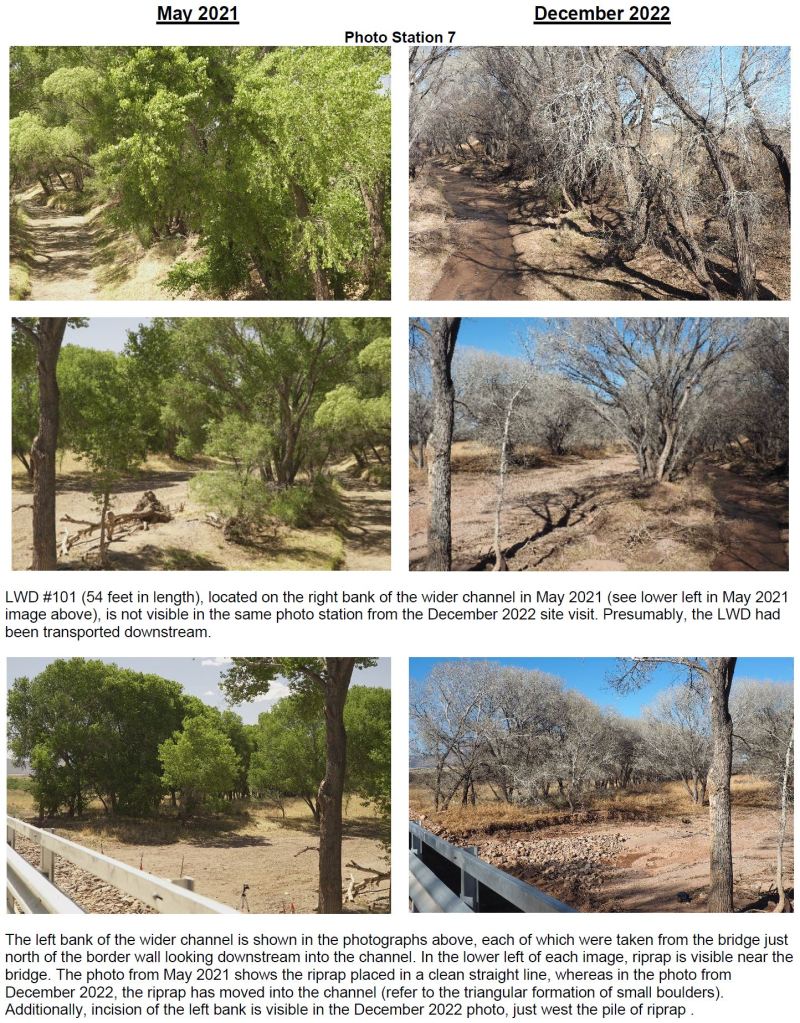
border wall and floodgates over the river and its floodplain. The repeat photos from station 7 indicate that LWD #110 was moved downstream between May 2021 and December 2022. Comparison between subsequent photos also indicate a change in bedform from a flat, sandy channel in May 2021 to a topographically complex channel made up of gravels and small cobbles in December 2022 (Figure 17). This is most clearly evident in the third photo from station 8. Photos from stations 8 and 10 show that riprap which was placed in a clean, straight line following construction of the floodgates was transported as far as 54 feet downstream by December 2022. The third photo from station 7 and the fourth photo from station 8 are perspectives into the wider channel taken from the bridge near the border wall. Incision of the left bank between May 2021 and December 2022 is evident from these images.
Similarly, the fourth photo from station 10 offers a perspective from within the wider channel where the incision of the left bank is clearer. Scour pools and piles of riprap are
visible adjacent to the incised channel in this photo.
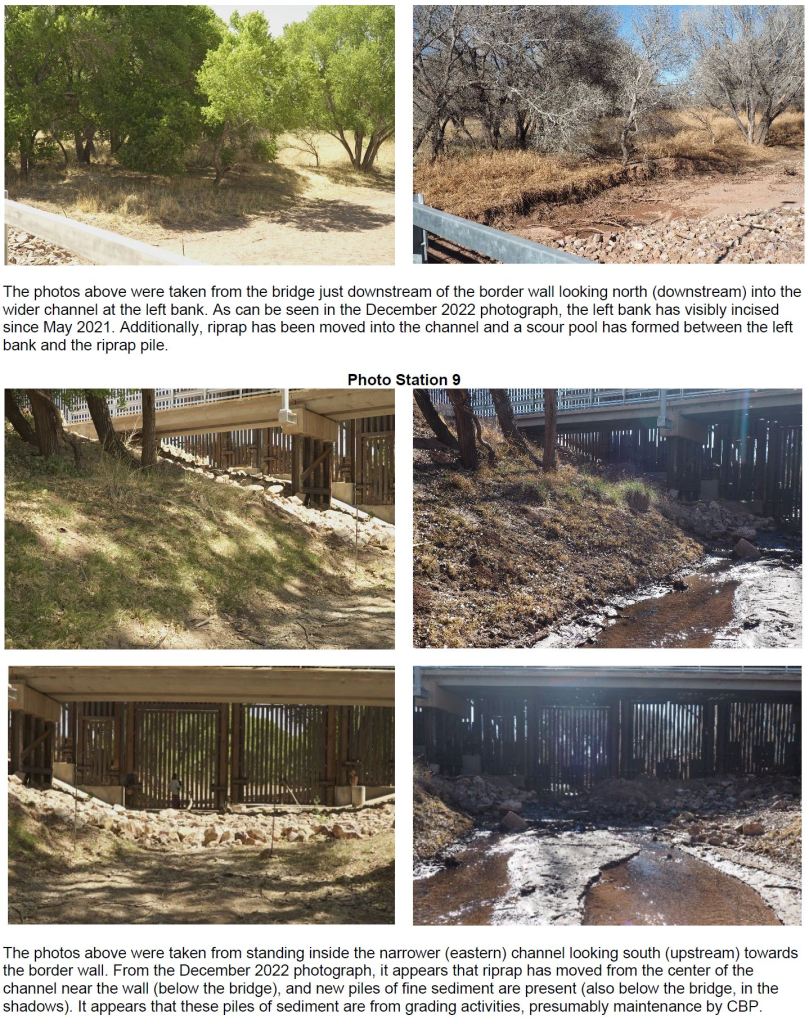
The second photo from station 9 is a perspective from within the narrower active
channel facing south in the direction of Mexico. Where riprap was placed in this channel
in May 2021, from the December 2022 photograph, it appears that much of this riprap
has either been transported downstream with floodwaters or intentionally removed. The
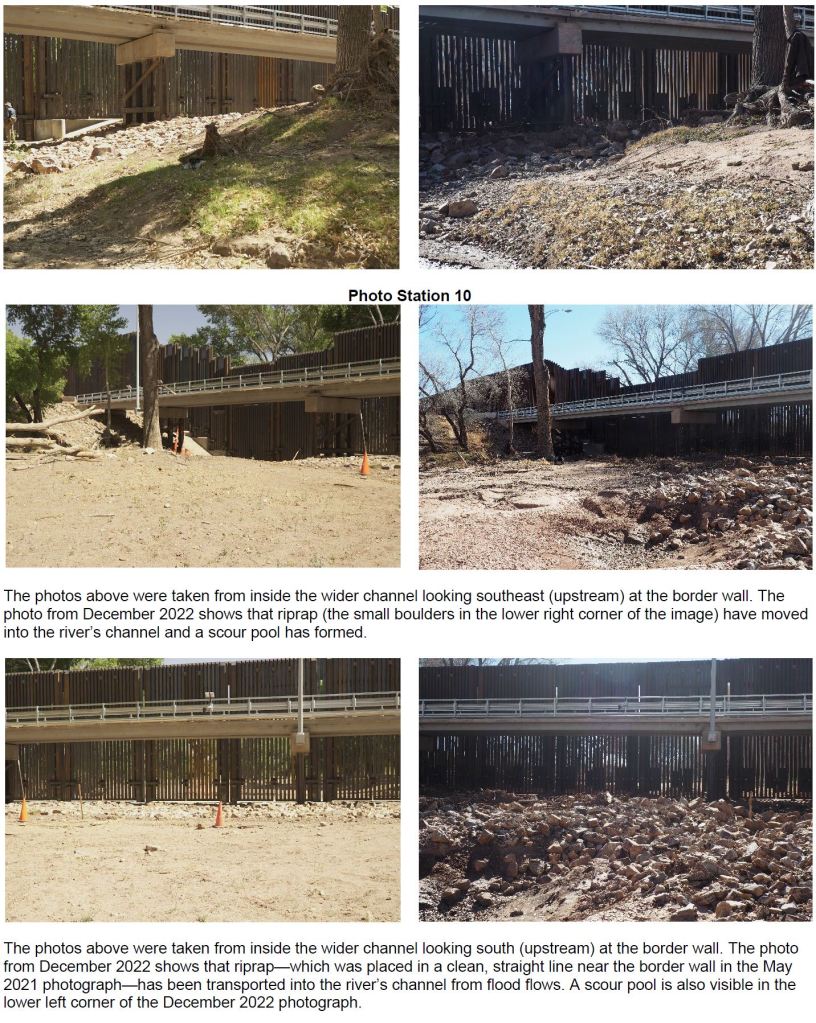
first photo at station 10 is a perspective from inside the main, wider channel facing
south/southwest in the direction of Mexico. This photo captures a large scour pool that
had formed adjacent to the riprap between 2021 and 2022. Similarly, the second and
third photos at station 10 illustrate a large pile of riprap-originally placed neatly
downstream of the wall at the time of the May 2021 survey- transported into the channel
in December 2022. A scour pool is also visible on the left side of the riprap pile in the
2022 images. The fourth photo from station 10 is a perspective from the same location
inside the main, wider channel, facing south/southeast toward the left bank. The riprap
pile is again visible, as is the incised left bank and a scour pool directly adjacent.
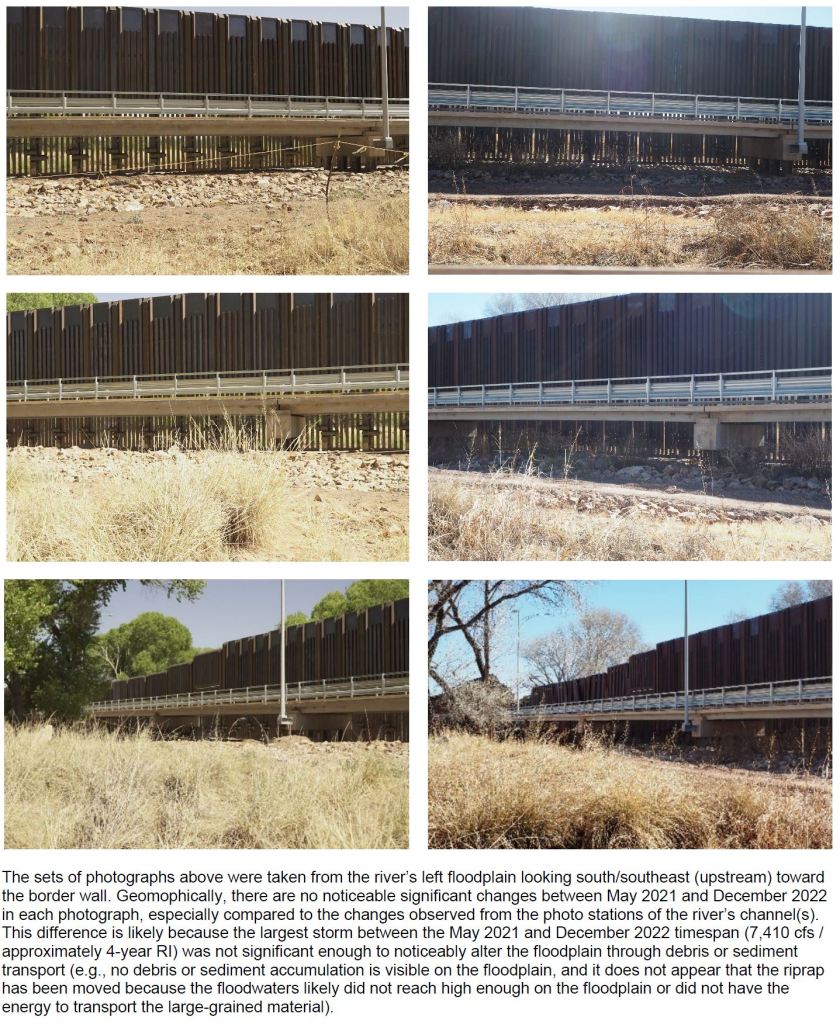
Repeat photographs from station 11 on the river’s left floodplain do not indicate
notable or remarkable changes between May 2021 and December 2022 surveys.


Debris Surveys
Each of the 9 pieces of LWD tagged in May 2021 were located downstream of
the border wall and were situated within one of the river’s channels (either the narrower
channel to the east, or the wider channel to the west). Two pieces of LWD were located
within the wider channel (101, 102) Four pieces of LWD were located on the right bank
of the narrower channel (103, 104, 105, 107). Further downstream from the wall, the
two channels combine into one larger channel. LWD #106, 107, and 109 were tagged in
this reach. LWD #103 was located the furthest up on the floodplain of all the LWD
tagged, and was situate on the right (eastern) bank of the river.
Of the debris tagged in May 2021, the average length was 27 feet and the
average width was 5 feet. The largest piece of LWD tagged in May 2021 (LWD #101)
and measured 54 feet in length and 6 feet in width and was located closest to the
border wall (e.g., furthest south) relative to the other LWD tagged. At 14 feet in length
and 1 foot in width, LWD 104 was the smallest piece tagged in 2021. Each of the LWD
tagged in May 2021 appeared to be cottonwoods. Except for LWD #105, all pieces of
LWD that were tagged still had a majority of their bark. LWD #105 appeared to have
been older, as it was stripped of its bark and smoother than the other pieces of LWD.
Results from May 2021 and December 2022 debris mapping, including GPS
coordinates, photographs, length and width measurements of debris, and descriptions
of location relative to the channel are summarized in Table 5. Figure 10 depicts the
LWD that was tagged in May 2021 and recovered in December 2022 (marked as a
white triangle) and the GPS locations for new recruitment LWD that was tagged in
December 2022 (marked as orange triangles).
Of the nine pieces of LWD surveyed in May 2021, only one was found in its initial
position during the December 2022 site visit (LWD 105; Table 5; Figure 10). LWD
measured 18.5 feet in length and 3 feet in width and was located on the right edge/bank
of the main channel in May 2021, where it remained when we recovered it in December 2022. The remaining LWD were not recovered during the December 2022 site visit.
LWD tagged in 2021 that were not recovered in 2022 may have been transported
downstream beyond the 0.3-mile study reach I traveled in search of the LWD. LWD may
also have been broken apart during floods, rendering them unrecognizable during the
December 2022 site visit. We tagged 3 new pieces of LWD in December 2022 that were not tagged in May 2021 (Figure 11). The locations of new recruitment LWD tagged in December 2022 are shown in Figure 10. GPS coordinates and descriptions of the new recruitment debris
tagged in December 2022 are recorded in Table 5. The new recruitment debris tagged
measured between 26 and 43.5 feet in length and were generally located near within
the river’s main channel downstream of the border wall.
Channel Surveys
Figure 12 indicates the location of each cross-sectional survey. Cross sectional
survey results from the December 2022 site visit are recorded in Figure 18.
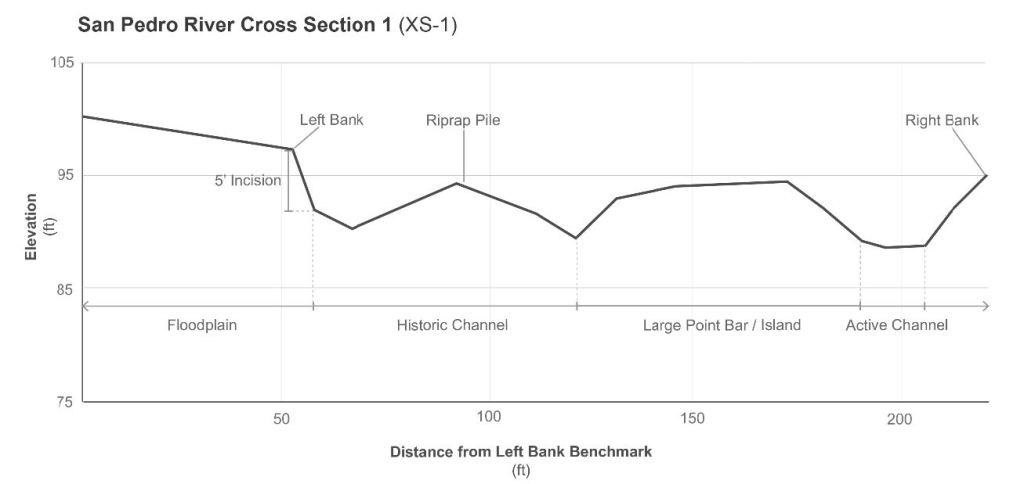
Cross section 1 (XS-1; Figure 18) is the furthest upstream (south) cross section
before reaching the border wall. The benchmarks established for this cross section are
cottonwood trees on the left and right banks of the river, each marked with a nail and
orange spray paint. Cross section 1 captures where the left bank has incised by
approximately 5 feet (station 55) and where a scour pool has formed in the channel
adjacent to the left bank (station 58). The average slope from the top to the base of the
left bank was measured to be approximately -72 degrees. The scour pool nearest the
left bank was measured to be 1.8 feet deep and 16 feet in width (measured from the
base of the left bank [station 58] to the edge of the riprap bordering the western wide of
the scour pool [station 74]). Bordering this scour pool near the east bank was a large
pile of riprap, which was transported into the channel from where it was originally placed
near the bridge downstream of the border wall following its construction in 2020. At
cross section 1, the riprap pile extended for 39 feet (e.g., eastern edge or riprap at
station 74 and western edge of riprap at station 113) and the pile of riprap reached a
height of 2.84 feet near its center (station 93). On the western side of this pile of riprap,
there was another scour pool in the wider channel, which reached 2.06 feet in depth
(station 122). This scour pool was 19 feet in width (measured from the edge of the
riprap [station 113] to the right bank of the wider of the San Pedro River’s two channels
at this location [station 132]). Between the wider, dry channel and the narrower, active
channel was a large point bar with cottonwood trees from station 132 to station 191.
The slope from the point bar down to the edge of the left bank of the narrower, active
channel averaged between -16.5 and -21.7 degrees. Station 191 in cross section 1 marks the left bank of the narrower, active channel, which measured 16 feet in width (station 191 at the left bank to station 207 at the right bank). The thalweg of the active channel was measured to be 0.4 feet in depth (station 197.3). The average slope of the right bank from the edge of the active channel to the right bank benchmark ranged between 25 and 40 degrees.
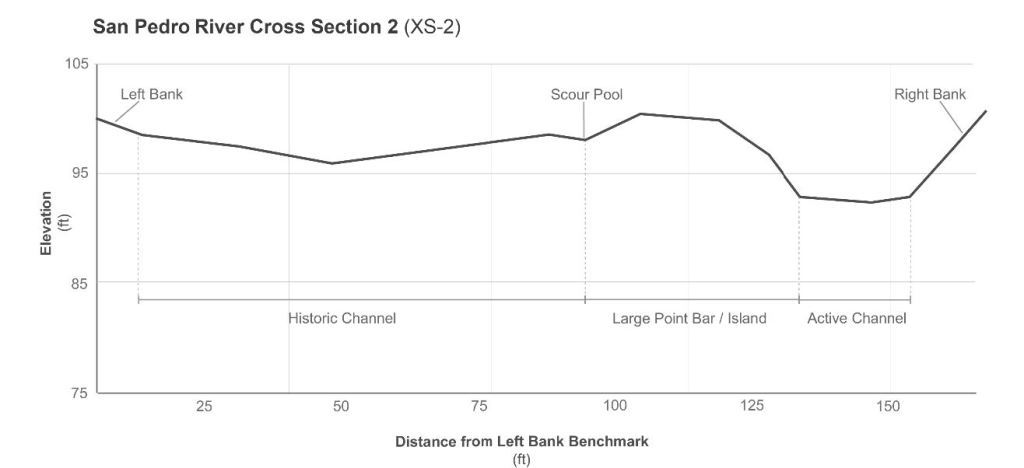
Cross section 2 (XS-2; Figure 18) was located approximately 80 feet downstream
from cross section 1. Benchmarks established for cross section 2 similarly are
cottonwood trees on the left and right banks of the river, each marked with a nail and
orange spray paint. Cross section 2 captures topography downstream of the riprap and
scour pools seen at cross section 1. The average slope from the edge of the left bank
into the main channel at cross section 2 was -9.8 degrees. The slope in the channel
varied between -2.3 and -4.8 degrees from the left bank toward the thalweg. From the
thalweg of the wider channel to the point bar near the right bank, the average slope was
approximately 4 degrees. At the western edge of the wider channel before the point bar,
the bank was incised by 0.58 feet (station 94.5). The slope from the point bar down to
the edge of the left bank of the narrower, active channel averaged between -22.3 and –
65.4 degrees. The thalweg of the active channel was measured to be 0.4 feet in depth
(station 147.64). The average slope of the right bank from the edge of the active
channel to the right bank benchmark ranged between 41.6 and 57 degrees.
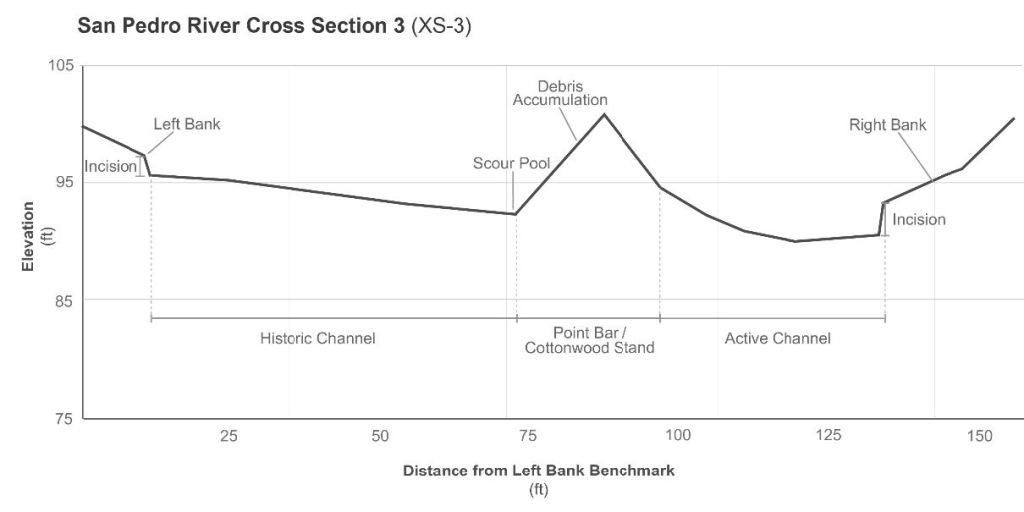
Cross section 3 (XS-3; Figure 18) was located the furthest downstream,
approximately 145 feet from cross section 2 (225 feet from cross section 1). Again,
benchmarks established for cross section 3 are cottonwood trees on the left and right
banks, each marked with a nail and orange spray paint. Cross section 3 captures large
debris accumulation at the cottonwood trees at the point bar between the wider dry
channel to the west and the narrower active channel to the east. The left bank of the
wider dry channel had incised by 1.54 feet (station 12). The average slope in the wider
dry channel ranged from -2 to -4 degrees from the left bank toward the right. At the right
bank/west edge of the wider main channel (station 87.5), a pile of LWD approximately
8.5 feet in height and 9 feet in width accumulated upstream of a stand of cottonwoods
near the point bar between the wide dry channel and narrow active channel. The
average slope from the channel to the top of the debris pile was approximately 51.8
degrees. From the top of the debris pile down to the left bank of the active channel, the
average slope was -78.8 degrees. The slope of the left bank leveled off between
degrees and degrees to the thalweg of the active channel. The thalweg of the active
channel was measured to be 0.4 feet in depth (station 120). The right bank of the active
channel was incised by 2.64 feet. The average slope of the incised right bank from the
edge of the active channel to the right bank benchmark ranged between 13.2 and 38.2
degrees.
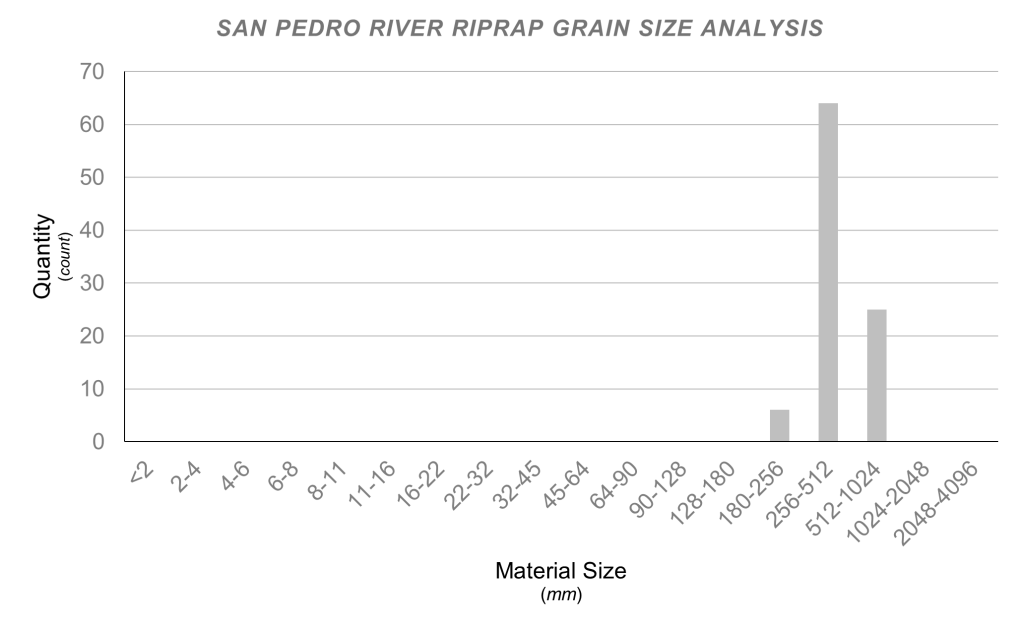
Grain Size Analyses
Grain size distributions from the pebble counts and sieve analysis conducted
during the December 2022 site visit are recorded in Figure 19 and Figure 20. Figure 19
represents the grain size distribution of what was determined to be native riverbed
material, and Figure 20 represents the grain size distribution of the riprap placed by
contractors during construction of the border wall and floodgates.
The mean particle size (D50) was 94 mm (medium cobbles) in the sample of
natural riverbed material and 434 mm (small boulders) in the sample of riprap. The
median particle size was 90 mm in the sample of natural riverbed material and 420 mm
in the sample of riprap. The most commonly occurring particle size was 100 mm in the
sample of natural riverbed material and 300 mm in the sample of riprap. The particle
size at the 90th percentile (D90) was 50 mm in the natural riverbed sample and 612 mm
in the riprap sample. The particle size at the 10th percentile (D10) was 50 mm in the
natural riverbed material and 300 mm in the sample of riprap. The relative standard
deviation in the distribution of the riprap was 0.3, whereas the relative standard
deviation in the distribution of the natural riverbed material was 0.4.
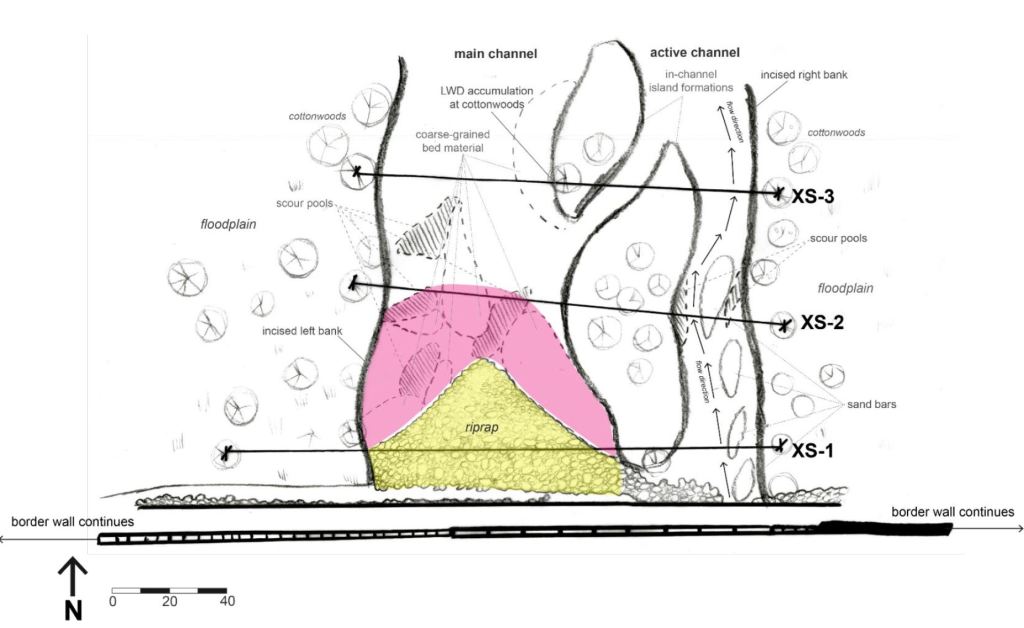
Figure 12 depicts a facies map that highlights the locations where pebble counts
and grain size analyses were conducted. The facies map indicates where riprap was
transported into the large channel downstream of the border wall. At its farthest point
into the channel, riprap was measured to have been transported 54 feet from its original
placement downstream of the bridge. The facies map also notes scour pools, debris accumulation, an incised left bank, and distinct areas composed homogenously of finer-
grained sand in some locations and larger-grained river rock in others. The facies map supports other survey data (e.g., forementioned findings from repeat photo stationing
and cross-sectional surveys) in illustrating the transformation of a flat channel
composed primarily of sand in May 2021 to a more topographically complex channel
with scour pools and piles of riprap in 2022.

Hydraulic Modeling
Results from hydraulic modeling simulations are compiled in Appendix B. Model
results include maximum inundation depth and maximum flow velocity for the following
simulations:
| Simulation No. | Storm Return Interval (years) | Border Condition | Debris Condition |
| 1 | 2 | Free (no wall) | N/A |
| 2 | 2 | Border wall and floodgates | 0′ accumulation (gates clear) |
| 3 | 2 | Border wall and floodgates | 3′ accumulation |
| 4 | 2 | Border wall and floodgates | 6′ accumulation |
| 5 | 50 | Free (no wall) | N/A |
| 6 | 50 | Border wall and floodgates | 0′ accumulation (gates clear) |
| 7 | 50 | Border wall and floodgates | 3′ accumulation |
| 8 | 5- | Border wall and floodgates | 6′ accumulation |

Maximum depth results from Simulation 1 (August 13-15, 2021, event [2-year RI]
with no border wall) illustrate active flow in the river’s main, narrow channel to the east
(e.g., near the right bank), streamflow in the wider (historic) channel, and that the
floodplains have been activated (ref. lightest shade of blue). Maximum velocity results
from Simulation 1 indicate the slowest moving water on the wetted floodplains (ref. dark
blue in map result), with higher velocities at the main narrower channel and the wider
historic channel surrounding it, as shown in green. The highest velocity flows appear to
be downstream of the wall where the river takes a sharp bend right/east, as indicated in
yellow/orange.
Maximum depth results from Simulation 2 (August 13-15, 2021, event with the
border wall and no debris) indicate similar results to those from Simulation 1 with
flooding slightly increased upstream of the wall on the right bank. Similarly, maximum
velocity results from Simulation 2 appear mostly consistent with simulation 1, except
velocity appears to have slightly increased at the floodgates compared to Simulation 1,
as indicated by the strip of green around the border wall.

Simulation 3 (August 13-15, 2021, event with the border wall and 3 feet of debris
accumulation) follows the same trend: there is a visible slight increase in flooding
upstream of the border wall on the right bank of the river, as shown in the maximum
depth result. The maximum velocity result from Simulation 3 indicates another slight
increase in velocity at the floodgates relative to Simulations 1 and 2, as indicated in
green.
The maximum depth results from Simulation 4 (August 13-15, 2021, event with
the border wall and 6 feet of debris accumulation) illustrated the most increased flooding
on the upstream, right bank side of the wall relative to the “free” condition (Simulation
1). A slight increase in flooding on the left floodplain (relative to Simulation 1) is also
detectable. Similarly, the maximum velocity results from Simulation 4 show that the flow
velocity around the border wall has increased relative to the “free” condition without a
wall (Simulation 1), as indicated by yellow highlighted around the border wall near the
center of the channel in Simulation 4 results.
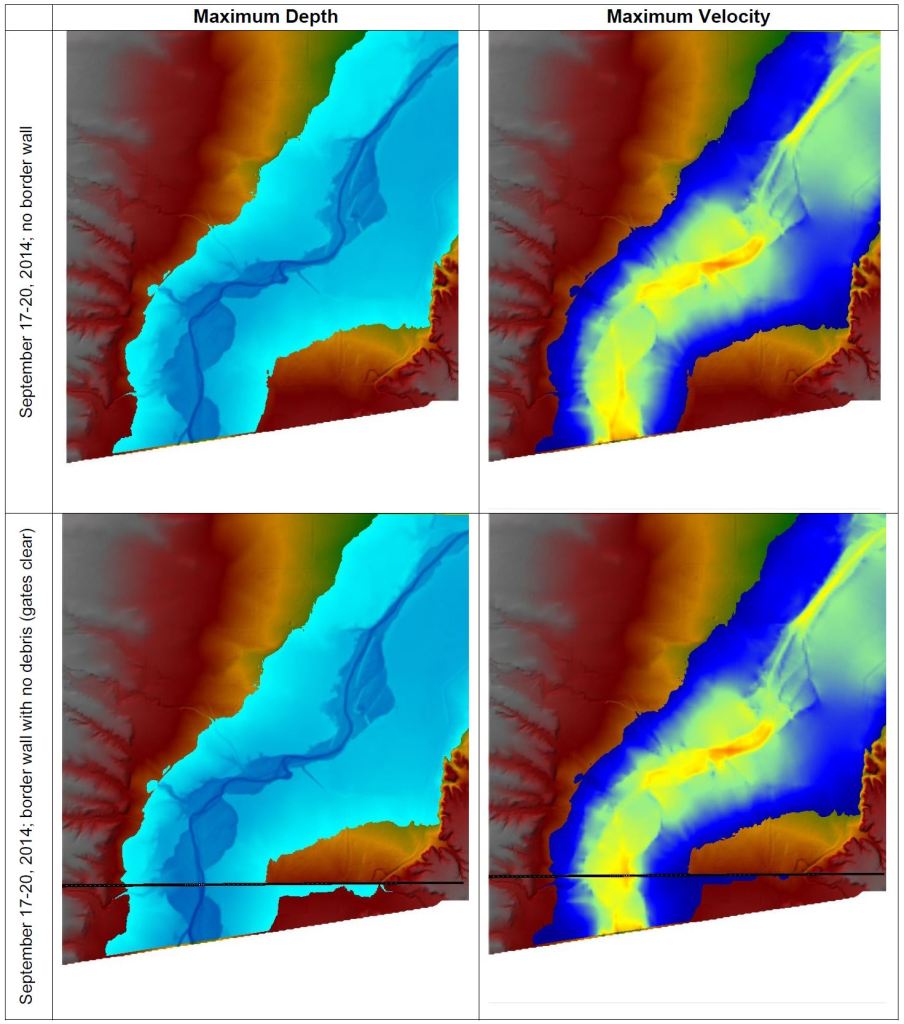
Hydraulic modeling results from simulations with a 50-year flood (Simulations 5-
8) follow a similar pattern as the results from simulations with a 2-year flood
(Simulations 1-4), only the changes are more apparent. Maximum depth results from
Simulation 5 (September 17-20, 2014, event [50-year RI] with no border wall) again
illustrate active flow in the river’s main, narrow channel to the east (e.g., near the right
bank), streamflow in the wider (historic) channel, and that the floodplains have been
activated (ref. lightest shade of blue). The floodwaters extend further east and west onto
the floodplains than in Simulations 1-4 with a 2-year flood event. Maximum velocity
results from Simulation 5 indicate the slowest moving water on the furthest edges of the
wetted floodplains (ref. dark blue in map result), with higher velocities at the main narrower channel (indicated in orange and red) and the wider historic channel
surrounding it, as shown in green. Velocities appear to be higher than in Simulations 1-4
with a 2-year storm event. In Simulation 5, the highest velocity flows appear to be
downstream of the wall where the river takes a sharp bend right/east, as indicated in
orange and yellow. This is consistent with the maximum velocity results from
Simulations 1-4, however, in Simulation 5, the velocities in this area appear higher (as
indicated by more orange compared to yellow in Scenarios 1-4). Additionally, more of
the streamflow is moving at a higher velocity than in Simulations 1-4. Velocities also
appear increased at the upstream edge of the study boundary, as indicated in orange
on the lower edge of the Simulation 5 maximum velocity result map.
Maximum depth results from Simulation 6 (September 17-20, 2014, event with
the border wall and no debris) indicate increased flooding upstream of the wall on the
right bank and extending across the floodplain. Maximum velocity results from
Simulation 6 illustrate increased velocity in the main channel at the floodgates in
comparison to the “free” condition (Simulation 5), as indicated by the line in
yellow/orange across the border wall.
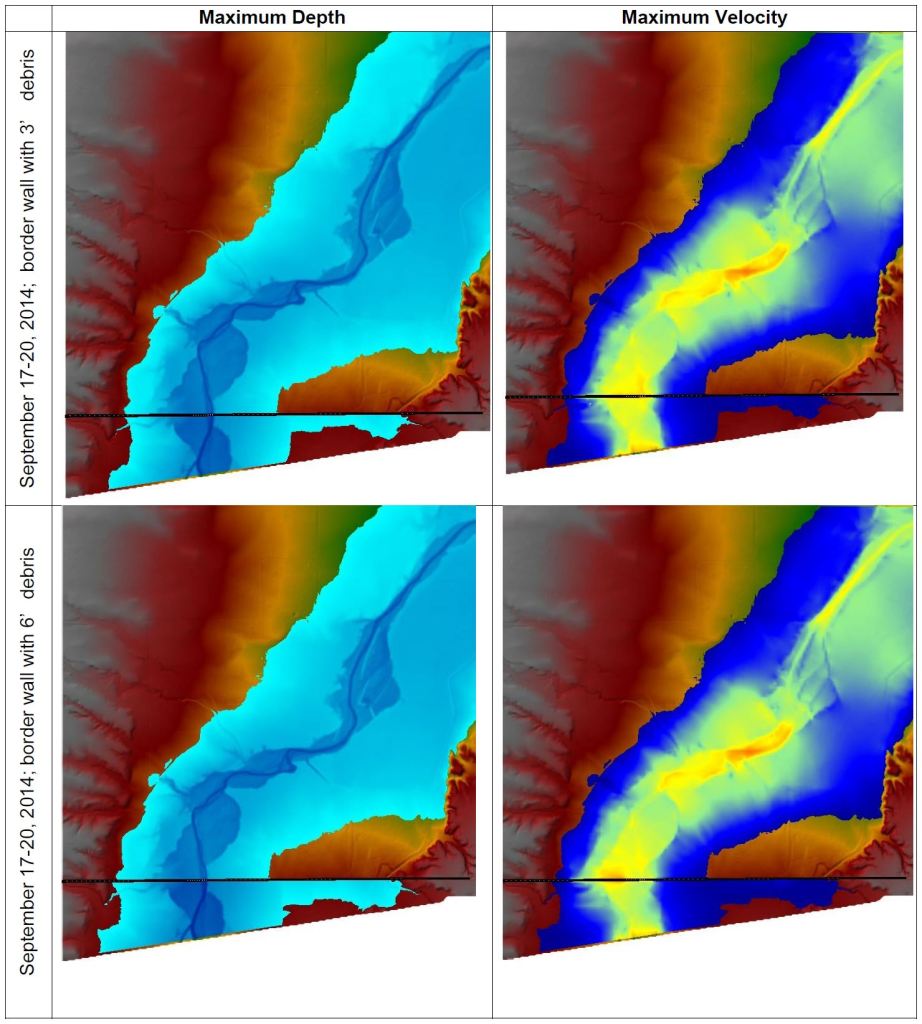
Maximum depth results from Simulation 7 (September 17-20, 2014, event with
the border wall and 3 feet of debris accumulation) indicate increased flooding on the
right bank on the upstream side of the wall more significantly than seen in Simulation 6
results. Flooding on the left bank appears relatively unchanged in comparison to
Simulation 6. Maximum velocity results in Simulation 7 do not appear to have
significantly changed from Simulation 6.
Maximum depth results from Simulation 8 (September 17-20, 2014, event with
the border wall and 6 feet of debris accumulation) depict the most extreme increase in
flooding upstream of the wall relative to the other 7 simulations performed. The
maximum depth results appear to depict slight but insignificant increases to flooding on
the left floodplain upstream of the wall. Maximum velocity results from Simulation 8
again depict increased velocities appearing to concentrate around the border wall’s
floodgates (as indicated in orange), only in this simulation, the increased velocities
appear to have shifted west in the direction of the left bank/smaller floodgates.
Overall, the hydraulic modeling results compiled in Appendix B illustrate
increased flooding (ref. maximum depth results) upstream of the border wall on the right
bank/floodplain in all scenarios where the border wall is present, regardless of if the
gates are clear from debris. Maximum velocity results indicate increased velocity at the
floodgates in the conditions where the wall is present, which may indicate scouring.
Model results show that flooding upstream of the wall is exacerbated in the 50-year storm (September 17-20, 2014, event) with 6 feet of debris accumulation.
Discussion
The key results from photo stationing between May 2021 and December 2022
illustrate that the channel downstream of the border wall had changed from a relatively
flat, sandy riverbed to a topographically variable bed composed of distinct areas of fine
sediments, medium cobbles (river rock), and small boulders (riprap). The incision of the
left bank at the time of the December 2022 survey is visible in multiple photo points (ref.
results from stations 7, 8, and 10), as is the large pile of riprap that had been
transported into the channel (ref. results from stations 7, 8, and 10). The movement of
LWD #101 between May 2021 and December 2022 surveys is also apparent in photo
stations 7 and 8.
The seasonal difference between the two surveys is apparent in comparison
between the photo stationing results. The 2021 survey was conducted in May (the driest
time of the year and before monsoon season), and in contrast, the 2022 survey took
place in December (following monsoon season and with potential for winter
precipitation, as was evident by active streamflow in the narrower channel). It is unclear
to what extent the season of each survey influenced the results. Perhaps following the
December 2022 survey, there may have been additional late winter storms—smaller in
nature than the large monsoon floods—that may have deposited fine sediments in the
channel, changing its bedform to more closely resemble what was observed during the
May 2021 site visit. Ideally, future site visits will be conducted during the same season
on (at least) an annual basis for a more consistent image of the river’s change over time
at the same point each year.
Photo stationing results—which are more qualitative in nature—are supported by
results from the debris surveys, cross-sectional surveys, and grain size analyses.
Debris Surveys
As referenced in photo station results from stations 7 and 8, LWD #101 (tagged
in May 2021) was not recovered during the December 2022 site visit. LWD #105—
which was 18.5 feet in length and 3 feet in width and situated up on the right bank of the
eastern channel—was the only piece of LWD recovered in December 2022. Since only
1 of the 9 pieces of LWD surveyed in 2021 was recovered in the December 2022
survey, it may be that the 2021 and 2022 storms were substantial enough to transport
the 8 pieces of unrecovered material downstream beyond the 0.3-mile study zone. Due
to time constraints, we were not able to travel further in search of the debris. Given
more time and additional team members assisting in search of the debris, we may have
recovered more of the May 2021 LWD. The LWD we recovered in December 2022 was
limited to what 3 people could find in the span of approximately 4 hours. It is also
notable that 1 of the 3 members in our December 2022 survey group had surveyed the
LWD initially in May 2021, meaning that she had the clearest picture/memory of what
each piece of LWD looked like and its position in the channel in May 2021. The other
two members of the survey group were searching for debris based on photos, GPS coordinates, and written description alone, which may have not been sufficient to
recognize the LWD in field. It may also be that how LWD #105 was situated in the bank
(e.g., up higher in the bank, somewhat partially embedded in sediment, and
adjacent/wedged between existing cottonwoods) that held it in place during the 2021
and 2022 storms compared to other LWD that appear to have been transported
downstream. Future surveying following the next seasonal storms will be needed to
further investigate.
Another reason that so much of the LWD was not recovered in December 2022
may be that the floods had broken the debris into smaller pieces, rendering them
unrecognizable. It is notable that the debris tagged in May 2021 was tagged in a central
location on the LWD but was not painted. If the debris was broken even into only 2 or 3
smaller fragments, it would have been essentially impossible to recognize without the
tree tag visible. Considering this possibility when tagging new recruitment LWD during
the December 2022 site visit, we were careful to use orange spray paint along the full
length of the LWD in hopes that—if the debris breaks apart in future floods—remnants
of it will be recognizable in future site visits.
Alternatively, additional debris and sediment may have accumulated and buried
the LWD tagged in May 2021, though this was not evident from field observations
during the December 2022 site visit.
The largest flood between the May 2021 and December 2022 surveys had a
peak flow of 7,410 cfs (August 2022), which is approximately a 4-year return interval
(USGS, 2022). It is notable that a relatively small flood (e.g., one that would be
expected every few years) has resulted in such distinct changes to the channel,
especially the formation of scour pools and the transportation of the riprap—which was
purportedly placed for erosion control—54 feet downstream from where it was observed
in 2021.
Tracks from grading equipment both up and downstream of the border wall were
visible at the time of the December 2022 site visit, which leads us to believe that debris
and sediments had been removed and/or the channel around the wall regraded before
the December 2022 site visit. U.S. Customs and Border Protection (CBP) has not made
public their costs for maintaining the border wall and/or for repairing damage from the
2021 and 2022 storms (Miroff, 2020). Considering the natural flood and debris transport
regimes of the San Pedro River, it is clear that removing accumulated debris and even
regrading the channel for flood conveyance will be required on a seasonal basis,
making maintenance costs a regular annual bill. Additionally, the San Pedro is only one
example of a transboundary river, as there are many other rivers and creeks (such as
the forementioned Silver Creek) that cross the border and would require similar
seasonal maintenance, thus magnifying yearly costs.
The American Immigration Council reported in 2019 that $274 million was spent
on border fence maintenance in 2017, before the wall was extended over the San Pedro River and other areas (U.S. Department of Homeland Security, 2017). Continuing the
wall over an additional 400 miles of the southern border in 2020 is estimated to have
tripled these maintenance costs to more than $750 million annually (American
Immigration Council, 2019).
Channel Surveys
Cross section 1 (XS-1) indicates the most varied topography of the three sections
surveyed, as this area was closest to the floodgate structure which may have been
starving the downstream area of sediment due to debris damming, creating a “hungry
water” effect (Kondolf, 1997). This sediment starvation may be what resulted in the 5-
foot incision of the left bank and formed the surrounding scour pools in the wider
channel. Cross section 2 (XS-2) indicates more of a “natural” channel form, presumably
what XS-1 may have looked like prior to construction of the wall, had the area been
surveyed in 2021. It is notable, again, given the timing of the December 2022 survey,
that there may have been additional, smaller winter storms that could have deposited
finer sediments and altered the river’s facies if surveyed during the dry season. Future
survey efforts should be conducted at the same time each year, ideally during the driest
season (May).
The large piles of debris accumulation observed downstream of the wall at cross
section 3 (XS-3) were not observed during the May 2021 site visit, but it is unclear
whether the presence of the border wall had any effect on the quantity of debris
accumulated downstream of the wall. We were surprised to find such large piles of
debris downstream of the border wall, since our prediction was that most of the woody
material was being trapped upstream of the floodgates. It is unclear whether the border
wall is having any effect on debris accumulation downstream of the wall, and future
surveys will be required to investigate this further.
Ecologically, it also remains to be investigated how this transition of a rather flat,
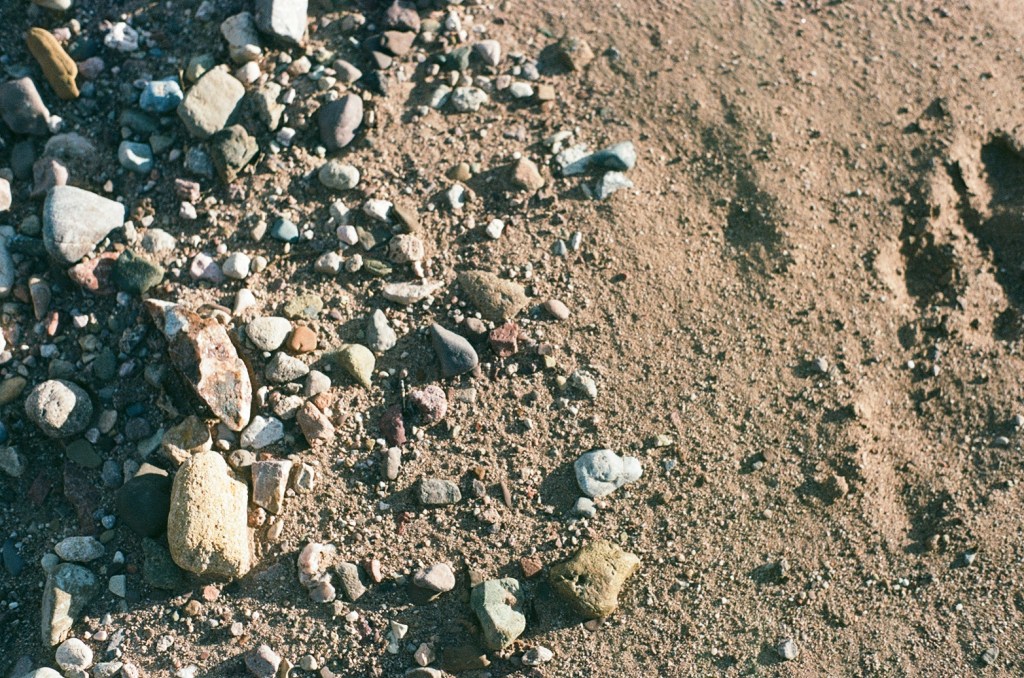
sandy bed into a more complex channel may affect local wildlife. Some animal tracks
were visible in the mud surrounding the scour pools, which held water at the time of the
December 2022 site visit. It is likely that these scour pools offered watering holes for
local wildlife, which may or may not have been available given the river’s apparent
topography from the May 2021 site visit. It could be that sediment deposition and
increased flooding create a backwater effect, potentially increasing wetland habitat. The
river’s bedform will continue to evolve each season. Further geomorphic monitoring—
perhaps paired with additional surveys of target species—are required to investigate
how new geomorphic patterns influenced by the wall affect different habitats.
Grain Size Analyses
While grain size analyses were not completed during the May 2021 site visit,
photo station results from the May 2021 site visit indicate that the channel appeared to
be of a more heterogeneous and finer-grained (e.g., sandier) bed composition. The
grain size analyses from December 2022 indicate a clear distinction between natural riverbed material (Figure 19) and the riprap placed downstream of the wall following its
construction (Figure 20). The average particle size of the material interpreted to be the
river’s natural bed material was a medium cobble (94 mm). The average particle size of
the riprap (small boulders) were significantly and intuitively larger at 434 mm. With a
relative standard deviation of 0.4, the distribution of the natural riverbed material ranged
between coarse gravels and very large cobbles. In comparison, the distribution of the
riprap material was narrower with a relative standard deviation of 0.3 and consisted of
particle sizes between very large cobbles and medium boulders. The USACE’s original
planning documents for the border wall have not been made public, so it remains
unclear how the design grain size and quantity of the riprap was determined for erosion
control measures. Since the riprap has been transported 54 feet downstream with a
peak flow of 7,410 cfs between May 2021 and December 2022 site visits, it remains
unclear for what recurrence interval storm the riprap material was sized.
The channel’s transformation to a more homogenous and variable composition of
bed material may be due to the presence of the wall and increased scouring, moving
the finer bed material downstream and depositing larger particles within the boundary of
the study site. Given the timing of the December site visit, it is also possible that later,
smaller winter storms may have altered the bed composition to potentially return it to a
finer-grained composition. Grain size distributions and bed topography will continue to
evolve with each flood. Additional surveys—ideally conducted at the same, driest time
each year—are required to further investigate how the border wall affects sediment
deposition and bedform.
Hydraulic Modeling
From the hydraulic modeling results, increased flooding on the right floodplain
was visible each simulation with the border wall in place (Simulations 2, 3, 4, 6, 7, and
8), regardless of whether debris was accumulated at the floodgates. This flooding may
be because only four of the smaller-sized gates are present on the right bank, so
floodwaters are building up at the wall, which is modeled as an impermeable weir.
Future modeling efforts should build from this model to incorporate variability in
permeability for the floodgates, the wall, and the debris, as this iteration treats each as
an impermeable structure, which is not the reality.
It is notable that flooding is exacerbated in the September 2014 event (a 50-year
RI), especially in Simulation 8 (6 feet of debris accumulation at the border wall).
Presumably, with larger storm events (e.g., a 100-year storm), this flooding would be
extended further onto the floodplain upstream of the wall. This would also mean debris
being carried downstream could be carried onto the floodplain beyond the border wall’s
floodgates, which may require further maintenance. Future modeling efforts should
incorporate sediment transport to further assess where channel erosion or
sedimentation may occur with each storm event and barrier condition. If possible,
modeling should incorporate subsurface dynamics to investigate how such flooding
interacts with groundwater. In the San Pedro River Watershed, any interventions that could have impacts to groundwater are frequently discussed. Further studies could
investigate how large flooding exacerbated by debris damming on the border wall may
act as groundwater recharge. As mentioned previously, investigations into how such
flooding may alter or increase wetland habitat upstream of the wall have yet to be
performed.
Other Observations, Limitations, and Opportunities for Future Study
The scope of this study was unfortunately limited due to lack of data available for
the Sonora portion of the watershed. The digital elevation model (DEM) used in
hydraulic modeling captured only a quarter of a kilometer upstream of the wall, as other
international-spanning DEMs were of coarse (30-meter) resolution. Because the width
of the San Pedro River’s channel at the study site is approximately 200 feet in width, the
30-meter resolution DEM was not sufficient to precisely model the river’s flows on the
site scale defined in this study. The river’s channels were not clearly defined in the 30-
meter DEM, which required me to modify the topography to carve in a representative
channel, introducing a new layer of assumption and uncertainty. This led me to instead
use the USGS 1-meter resolution DEM, which offered more precisely defined
topography at the cost of including more terrain upstream of the border.
Regarding the original hydraulic model used by the USACE to design the border
wall’s floodgates, the original design documents for the border wall and floodgates have
not been made publicly available, and the USACE South Pacific Border District that was
created to manage the construction of the border wall has since been dissolved. It
remains questionable what modeling and assumptions were performed in the design of
the floodgate system for the San Pedro River as well as other rivers that cross the
border.
Lack of connections and access to the Sonora portion of the watershed for
surveying in May 2021 and December 2022 meant that cross sections, grain size
analyses, and photo stationing could only be completed downstream of the wall. To get
a clearer picture of how the border wall and floodgates affect processes of flooding and
erosion on the San Pedro River, incorporating topographical data upstream of the
wall—where the flooding and deposition is occurring—is crucial. Future studies should
prioritize partnerships with organizations and landowners in Sonora, and work with
Customs and Border Protection and the Mexican government to obtain the permits
necessary for surveying work upstream of the wall, including collection of LiDAR. The
Nature Conservancy (TNC) and Watershed Management Group (WMG) lead wet-dry
mapping and beaver survey efforts, respectively, on an annual basis with watershed
stewards (The Nature Conservancy, 2022; Watershed Management Group, 2022).
Ideally, the debris monitoring and surveying methods outlined in this study can be
repeated by local volunteers following seasonal storm events. As evident by the
decades of community-led wet-dry mapping across the length of the San Pedro River,
this watershed has a legacy of community stewardship, action, and cooperation that has
informed regional policy (The Nature Conservancy, 2022). In such a setting, initiating a debris monitoring program seems an appropriate and timely opportunity to engage
community members and catalog how the river’s morphology and debris accumulation
changes over time with the presence of the border wall.
Another limitation of this study is the lack of transparency from CBP regarding
maintenance activities and costs for maintaining the floodgates. During the site visit in
December 2022, we observed tracks from grading equipment beneath the bridge
downstream of the border wall. On the upstream side of the wall, we were able to
observe similar evidence of grading equipment (e.g., tracks and the lack of large woody
debris behind the larger floodgates), suggesting some form of floodgate maintenance
took place following the 2022 monsoon season to move sediments and LWD that would
have accumulated upstream of the wall. It is apparent that some form of seasonal
maintenance, debris removal, and regrading of the channel is ongoing, yet the protocols
and frequency of these operations is unknown. Since both scour pools and evidence of
grading equipment were observed, it is unclear which pools were formed by the river’s
natural process of scouring and which pools were formed by excavating accumulated
sediment and debris. CBP’s full maintenance protocols for the floodgates and border
wall have yet to be shared but are a critical component in understanding to what extent
the river’s morphology is influenced by fluvial processes rather than by maintenance
interventions. Additionally, contracts for the grading and debris removal operations are
not publicly available, and annual costs for maintaining the floodgates are unknown.
Some estimates place annual maintenance costs at a minimum of $864,000 per mile
per year (Hulseman, 2019), and others estimate annual maintenance costs for the
entire length of the border wall up to $750 million (American Immigration Council, 2019;
U.S. Department of Immigration, 2017).
Lastly, the design of the floodgates on the San Pedro River is not unique to this
site. Similar designs were employed where the border wall crosses other transboundary
rivers, such as Silver Creek near the San Bernardino National Wildlife Refuge. The
same limitations to debris transport and longitudinal connectivity that are presented by
the wall on the San Pedro River presumably affect other international waters as well. While there is a plethora of documentation on the impacts of dams, weirs, and other in-
channel structures on longitudinal connectivity of rivers, the border wall floodgate infrastructure represents a novel type of barrier that warrants future study.
Conclusions
As evident by streamflow records and historical accounts of flooding, the speed
and unpredictability in which storm events develop is common to the San Pedro River.
The river’s flow regime naturally fluctuates: nonexistent flow is interrupted by brief
periods of intense flash flooding capable of eroding banks, carving new channels, and
wiping out human infrastructure in a single storm event. The border wall is the latest
iteration in a history of infrastructural projects that bisect the river, and evidence of
debris accumulation and seasonal maintenance to remove it is already apparent.
The changes to the river’s bedform downstream of the wall, the (apparent)
transport of 8 of 9 of the LWD tagged in 2021, and the visible increase in woody debris
accumulation observed during the December 2022 site visit occurred with a peak
streamflow of 7,410 cfs (a return interval of approximately 4 years). Results
documented here following the 2021 and 2022 floods demonstrated that debris is easily
trapped and the channel downstream of the wall has been visibly changed with a
relatively frequent storm event. We have not documented a large buildup of woody
debris becoming trapped in the floodgates yet, though this will inevitably occur in a
larger flow. Hydraulic modeling results indicate that increased flooding upstream of the
wall is likely to occur with a larger storm, especially if debris is already built-up at the
floodgates.
This study has documented trapping of debris on the border wall’s floodgates,
changes to riverbed grain size, scouring, and incision, each of which present more of an
issue for the border wall itself than for the San Pedro River. The San Pedro River will
recover from these effects downstream as local hydraulics will be modified with each
flood and grain size distributions and bed topography will naturally evolve. Whether or
not this has significant ecological consequences remains to be seen. However,
accumulation of debris on the floodgates threatens the structure of the floodgates
themselves, as does scouring under and/or around the gates.
The San Pedro River has been studied extensively and many efforts have been
made to preserve it, especially over the last few decades. The most pertinent issues
have largely been surrounding threats to groundwater and streamflow permanence.
Now, the river is confronted by a new threat, which is the impact of the border wall as a
blockage to mammal migration, as well as the constriction of wood supply. The border
wall is a new type of barrier to a free-flowing river that warrants future study beyond the
San Pedro, as this river is only one in a series of rivers that cross the US-Mexico border
and face this condition.
Bibliography
The AMBER Project (2023). Website accessed. 23 February 2023.
https://amber.international/european-barrier-atlas/
American Immigration Council (2019). The High Cost and Diminishing Returns of
a Border Wall. 6 September 2019.
https://www.americanimmigrationcouncil.org/sites/default/files/research/the_high
_cost_and_diminishing_returns_of_a_border_wall.pdf
Arizona Geological Survey Staff (2009). Holocene Mapping of the San Pedro
River System: A
Geologic Approach to an Environmental Problem – Water Resource
Management.
Website accessed. 02 February 2023.
https://azgeology.azgs.arizona.edu/archived_issues/azgs.az.gov/arizona_geolog
y/summ
er09/article_sanpedro.html
The Arizona Republican (1896). Big Floods at Benson, Cloudburst in the
Whetstone Range, Damage Done to the Southern Pacific, Buildings Washed
Away and Several Lives Reported Lost. The Arizona Republican: VII, 116. 2
October 1896. Website accessed. 20 February 2023.
https://chroniclingamerica.loc.gov/lccn/sn84020558/1896-10-02/ed-1/
The Arizona Silver Belt (1890). Communication. The Arizona Silver Belt: 3. 30
August 1890. Website accessed. 20 February 2023.
https://chroniclingamerica.loc.gov/lccn/sn84021913/1890-08-30/ed-1/seq-3/
The Arizona Silver Belt (1893). Territorial Items. The Arizona Silver Belt: XVI, 23.
02 September 1893. Website accessed. 20 February 2023.
https://chroniclingamerica.loc.gov/lccn/sn84021913/1893-09-02/ed-1/seq-1/
Arizona Weekly Citizen (1891). Arizona Weekly Citizen: 2. 14 March 1891.
Website accessed. 20 February 2023.
https://chroniclingamerica.loc.gov/lccn/sn82015133/1891-03-14/ed-1/seq-2/
Arizona Weekly Citizen (1889). From Tres Alamos. Arizona Weekly Citizen: 3. 27
July 1889. Website accessed. 20 February 2023.
https://chroniclingamerica.loc.gov/lccn/sn82015133/1889-07-27/ed-1/seq-3/
Barnes, H.H., Jr. (1967). Roughness Characteristics of Natural Channels. US
Geological Survey Water-supply paper 1849.
The Bisbee Daily Review (1905). Railroads Knocked Out by Rains. 18 March
- The Bisbee Daily Review. Website accessed. 20 February 2023.
https://chroniclingamerica.loc.gov/lccn/sn84024827/1905-03-18/ed-1/seq-8/
The Bisbee Daily Review (1914). Water Damage on San Pedro River to Farms,
Railroads and Highways is Great – Floods Over Mile Wide. The Bisbee Daily
Review: 17, 173. 24 December 1914. Website accessed. 20 February 2023.
https://chroniclingamerica.loc.gov/lccn/sn84024827/1914-12-24/ed-1/seq-1/
Branco, P., Segurado, P., Santos, J.M., & Ferreira, M.T. (2014). Prioritizing
barrier removal to improve functional connectivity of rivers. Journal of Applied
Ecology, 2014, 51, 1197-1206. doi: 10.1111/1365-2664.12317
Carnahan, Susan & Van Devender, Thomas & Reina-Guerrero, Ana-Lilia &
Anderson, John & Sánchez-Escalante, José & Molina-Padilla, Guillermo (2018).
Preliminary Flora and Vegetation of the Sierra la Elenita-la Mariquita Sky Island
Complex, Sonora, Mexico. The Plant Press. Arizona Native Plant Society. Fall
2018.
Center for Biological Diversity (2019). Trump Administration Waives
Environmental Laws to Build Border Walls in New Mexico, Arizona. Website
accessed. 02 February 2023.
Death in Hot Springs Canyon. Website accessed. 14 November 2022.
https://sanpedrorivervalley.org/hsc_flood_deaths.htm
U.S. Department of Homeland Security (2017). Congressional Budget
Justification FY 2017, 1(8).
https://www.dhs.gov/sites/default/files/publications/FY%202017%20Congression
al%20Budget%20Justification%20%20Volume%201_1.pdf.
Harrelson, C.C., Rawlins, C.L., & Potyondy, J.P. (1994). Stream channel
reference sites: An illustrated guide to field technique. Page RM-GTR-245. U.S.
Department of Agriculture, Forest Service, Rocky Mountain Forest and Range
Experiment Station, Ft. Collins, CO.
Hulseman, K.G. (2019). Trump’s Border Wall Is an Expensive, Ineffective
Application of Eminent Domain. Center for American Progress. 25 April 2019.
Website accessed 23 February 2023.
Kepner, W., Edmonds, C., & Watts, C.J. (2002). Remote Sensing and
Geographic Information Systems for Decision Analysis in Public Resource
Administration: A Case Study of 25 Years of Landscape Change in a
Southwestern Watershed. U.S. Environmental Protection Agency Office of
Research and Development National Exposure Research Laboratory. June 2002.
KOLD News 13 (2022). Man, child stranded because of high water in Cochise
County. 04 August 2022. Website accessed 07 November 2022.
https://www.kold.com/2022/08/04/man-child-stranded-because-high-water-cochise-county/
Kondolf, G. (1997). PROFILE: Hungry Water: Effects of Dams and Gravel Mining
on River Channels. Environmental Management 21, 533–551. July 1997.
https://doi.org/10.1007/s002679900048
Miroff, N. (2020). Long-term maintenance for Trump’s border wall could cost
billions, but government isn’t saying. The Washington Post. 5 February 2020.
National Audubon Society (2022). San Pedro Riparian National Conservation
Area. Website accessed. 03 December 2022.
https://www.audubon.org/important-bird-areas/san-pedro-riparian-national-conservation-area
The Nature Conservancy (2022). Mapping the Status of River Streams, Wet/Dry
Mapping in Arizona. The Nature Conservancy, Arizona Conservation Science.
Website accessed. 3 November 2022.
https://azconservation.org/project/wet_dry_mapping/
NOAA National Weather Service. Southeast Arizona Flood History. NWS Tucson
Arizona. Website accessed. 29 November 2022.
https://www.weather.gov/twc/hydro_floodhistory#SEPT1926
Noonan, G.R. (2022). Massive floods, 1 or 2 mile Wide River, People in Trees, &
Cutting of the San Pedro River Arroyo. Unpublished manuscript. Website
accessed. 07 November 2022. https://scihistory.info/massive-floods-cut-
arroyos.html
Noonan, G.R. (2019). Arroyos and the Upper San Pedro River Riparian Forests.
Website accessed. Unpublished manuscript. 07 November 2022.
https://scihistory.info/arroyos-and-riparian-forests.html
Peters, R., Ripple, W.J., Wold, C., Moskwik, M., Carreón-Arroyo, G., Ceballos,
G., Córdova, A., Dirzo, R., Ehrlich, P.R., Flesch, A.D., List, R., Lovejoy, T.E.,
Noss, R.F., Pacheco, J., Sarukhán, J.K., Soulé, M.E., Wilson, E.O., Miller, J.R.B.,
& 2556 scientist signatories from 43 countries (including 1472 from the United
States and 616 from Mexico). (2018). Nature Divided, Scientists United: US-
Mexico Border Wall Threatens Biodiversity and Binational Conservation.
BioScience, 68(10), October 2018, pp. 740–743.
https://doi.org/10.1093/biosci/biy063
Pool, D.R., & Coe, A.L. (1999). Hydrogeologic Investigations of the Sierra Vista
Subwatershed of the Upper San Pedro Basin, Cochise County, Southeast Arizona. Water-Resources Investigations Report 99—4197. US Geological
Survey, Arizona Department of Water Resources, Cochise County.
Rodeles, A.A., Galicia, D., & Miranda, R. (2020). Barriers to longitudinal river
connectivity: review of impacts, study methods and management for Iberian fish
conservation. Limnetica, 39(2): 601-619 (2020). DOI: 10.23818/limn.39.39
Stromberg, J.C., & Tellman, B. (2012). Ecology and Conservation of the San
Pedro River. University of Arizona Press.
Taylor, P.D., Fahrig, L., Henein, K., & Merriam, G. (1993). Connectivity is a vital
element of landscape structure. Oikos, 68(3), 571-573.
https://doi.org/10.2307/3544927
Tellman, B., & Hadley, D. (2006). Crossing Boundaries: An Environmental
History of the Upper San Pedro River Watershed, Arizona and Sonora (53).
Sponsored by the U.S. Department of Interior’s United States-Mexico Border
Field Coordinating Committee Through the Bureau of Land Management and the
Cochise County Department of Highway and Flood Control.
Tombstone Epitaph (1890). Tombstone Epitaph: 2-3. 2 August 1890. Website
accessed. 20 February 2023.
http://chroniclingamerica.loc.gov/lccn/sn95060905/1890-08-02/ed-1/seq-3/
Tombstone Epitaph (1896). The Floods: More Rains and Washouts at Benson.
Tombstone Epitaph: 2. 18 October 1896. Website accessed. 20 February 2023.
https://chroniclingamerica.loc.gov/lccn/sn95060905/1896-10-18/ed-1/seq-2/
Tombstone Epitaph (1914). Rain causes big flood. 23 August 1914. Tombstone
Epitaph: 2. Website accessed. 20 February 2023.
https://chroniclingamerica.loc.gov/lccn/sn95060905/1914-08-23/ed-1/seq-2/
Tuan, Y. (1962). Structure, Climate, and Basin Land Forms in Arizona and New
Mexico. Annals of the Association of American Geographers, 52: 51-68.
https://doi.org/10.1111/j.1467-8306.1962.tb00395.x
U.S. Department of the Interior Bureau of Land Management (2022). San Pedro
Riparian National Conservation Area. Website accessed. 3 December 2022.
https://www.blm.gov/national-conservation-lands/arizona/san-pedro
U.S. Fish and Wildlife (2022). Species Profile: Jaguar (Panthera Onca). Website
Accessed. 16 November 2022. https://ecos.fws.gov/ecp/species/3944
U.S. Fish and Wildlife (2022). Species Profile: Southwestern Willow Flycatcher
(Empidonax trailii extimus). Website accessed. 16 November 2022.
https://ecos.fws.gov/ecp/species/3482
U.S. Geological Survey (2022). National Water Information System: Web
Interface. Peak streamflow data, hydrography, Streamstats. USGS Gage
09470500 San Pedro River at Palominas, AZ. Website accessed. 3 November
U.S. Geological Survey (2022). National Water Information System: Web
Interface. Peak streamflow data, hydrography, Streamstats. USGS Gage
09470500 San Pedro River at Palominas, AZ. Website accessed. 3 November 2022. https://waterdata.usgs.gov/monitoring-
location/09470500/#parameterCode=00060&startDT=2021-08-01&endDT=2021-08-31 http://nhd.usgs.gov/
U.S. Geological Survey Fact Sheet 2005-3081 (2022). Hydrologic Conditions in
Arizona During 1999–2004: A Historical Perspective. Website accessed. 20
February 2022. https://pubs.usgs.gov/fs/2005/3081/
Vannote, R.L., Mishall, G.W., Cummins, K.W., Sedell, J.R., & Cushing, C.E.
(1980). The River Continuum Concept. Canadian Journal of Fisheries and
Aquatic Sciences, 37(1), 130-137. https://doi.org/10.1139/f80-017
Ward, J.V. (1997). An Expansive Perspective of Riverine Landscapes: Pattern
and Process Across Scales. GAIA: Ecological Perspectives for Science and
Society, 6(1), 52-60. https://doi.org/10.14512/gaia.6.1.6
Watershed Management Group (2022). 2nd Annual Bi-National Beaver Survey:
San Pedro Riparian National Conservation Area (SPRNCA) Dec 3. Website accessed 19 November 2022. https://watershedmg.org/event/2nd-annual-bi-
national-beaver-survey-san-pedro-riparian-national-conservation-area-sprnca-
dec
Wolman, M.G. (1954). A method of sampling coarse river-bed material.
Transactions American Geophysical Union, 35(6), 951-956.
Wood, Tom (2015). Friends of the San Pedro River Roundup. Winter 2014/2015.
Historical Floods.
Pearce, F. (2022). Fenced In: How the Global Rise of Border Walls Is Stifling
Wildlife. Yale Environment 360. 16 November 2022.
https://e360.yale.edu/features/border-walls-animals-climate-change
